- WTI repeatedly pulls back from $36.00, prints two-day losing streak in Asia.
- Sustained trading below 61.8% Fibonacci retracement, first bearish MACD signal in six weeks favor the sellers.
- Bulls seek a clear break above $40.00 for fresh entries.
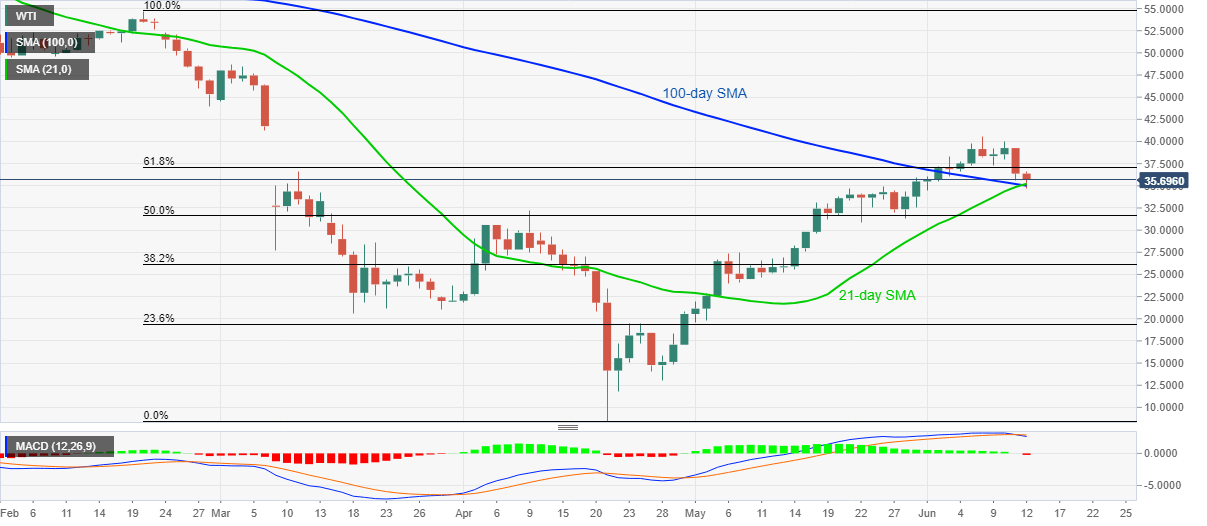
WTI eases to $35.90, down 1.30% on a day while heading into the European session on Friday. In doing so, the energy benchmark remains below 61.8% Fibonacci retracement level of February-April fall but fails to slip under a joint of 100-day and 21-day SMA. Though, the MACD histogram flashes bearish signals for the first time since late-April and keeps the sellers hopeful.
As a result, the bears need to wait for a daily closing below $35.00 to extend the fall towards April month top near $32.20. During the quote’s further weakness past-$32.20, 50% Fibonacci retracement level of $31.60 might question the fall.
However, any more downside under $31.60 will not hesitate to aim for $30.00 and then target the early-May month high surrounding $27.50.
Meanwhile, an upside clearance of 61.8% Fibonacci retracement, at $37.10, isn’t expected to please the bulls as $40.00 is more likely to raise the bars during the additional rise.
Should there be a successful north-run past-$40.00, $40.60 and the early-March low near $41.22 might return to the charts.
WTI daily chart
Trend: Bearish
