- WTI bounces off $52.03 following the heaviest drop in a week.
- Bearish MACD, sustained break of the key support line favor sellers.
- 10-day SMA, two-week-long resistance line add to the upside barriers.
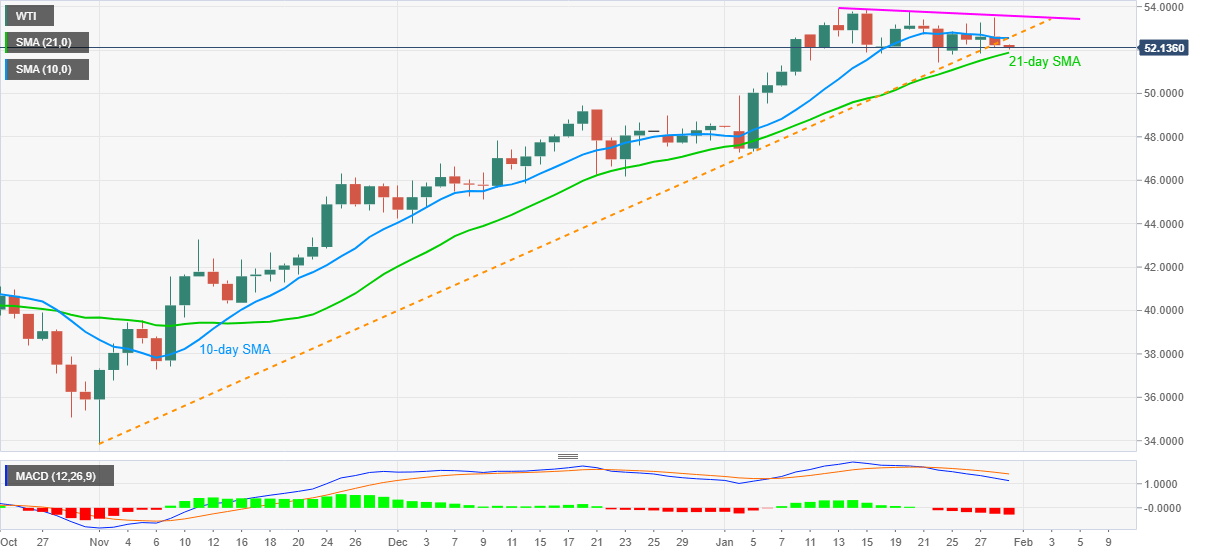
WTI consolidates recent losses near $52.10 during the early Asian session on Friday. In doing so, the energy benchmark portrays a corrective pullback from 21-day SMA while keeping the previous day’s break of an ascending trend line from November 02.
Although 21-day SMA restricts the black gold’s immediate downside, bearish MACD signals and a successful break of short-term key support line, also near to the 10-day SMA, favor the oil sellers.
Hence, WTI bears are likely waiting for a 21-day SMA break, currently around $51.85, to extend Thursday’s losses below the stated support line, now resistance.
Following that, the $50.00 and December’s top near $49.40 should return to the chart before directing the quote towards the monthly low of $47.25.
Meanwhile, 10-day SMA joins the previous support line to test the bull’s commitment around $52.55. Also acting as the key hurdle is a falling trend line from January 13 near $53.60.
Should WTI manages to cross $53.60, the bulls can easily refresh the monthly top of $53.93 and attack the $54.00 threshold.
WTI daily chart
Trend: Further weakness expected
