- WTI struggles to extend the recent pullback from the multi-week low.
- Bearish MACD, trading below the key resistances keeps sellers hopeful.
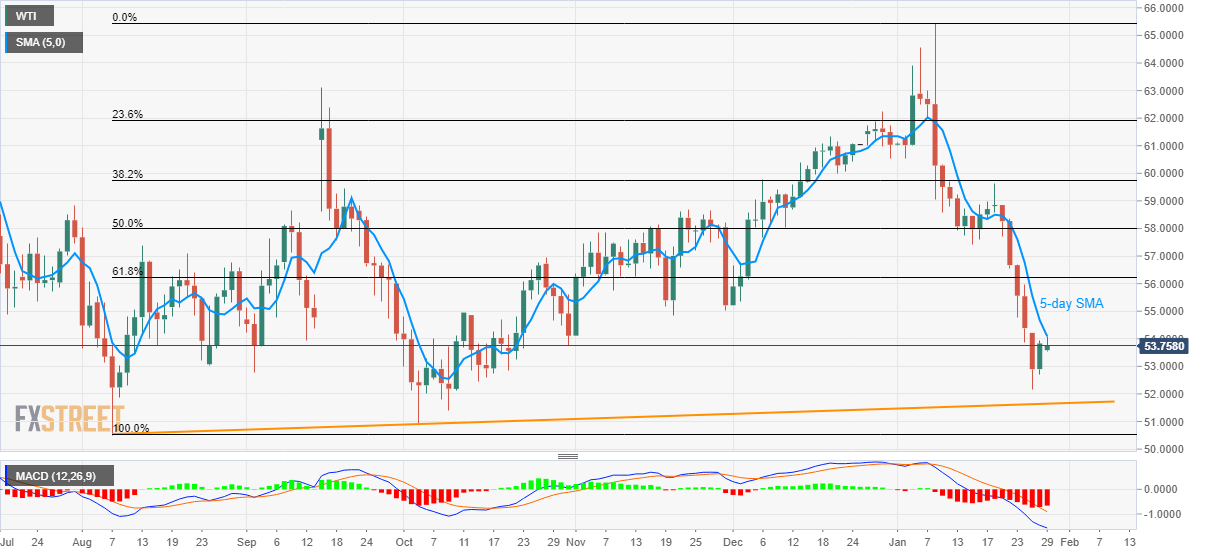
- An ascending support line from August 2020 on the bear’s radar.
WTI pulls back from the intra-day high of $54.08 to $53.75 by the press time of early Asian session on Wednesday. In doing so, the energy benchmark fails to clear the short-term key moving average. The same, while mixed with bearish MACD, portrays the underlying momentum weakness in the black gold’s trading.
Not only a 5-day SMA level of $54.05 but November 20, 2019 low near $54.85 and 61.8% Fibonacci retracement of the commodity’s August 2019 to January 2020 upside, at $56.25, also act as the key upside barriers.
Should oil prices manage to cross $56.25 on a daily closing basis, the bulls can aim for $57.50.
Alternatively, the recent low of $52.15 and an upward sloping trend line since August 07, 2019, at $51.65 now, can please the sellers during fresh declines.
During the quote’s additional weakness past-$51.65, October 2019 low of $50.95 and August 20018 bottom around $50.50 can offer intermediate halts before highlighting $50.00 for the bears.
It’s worth mentioning that the private reading of the US weekly oil inventories published by the American Petroleum Institute (API) recently confirmed a draw of 4.27 million barrels for the week ended on January 24.
WTI daily chart
Trend: Bearish
