- WTI remains on the back foot while trading near a 16-week low.
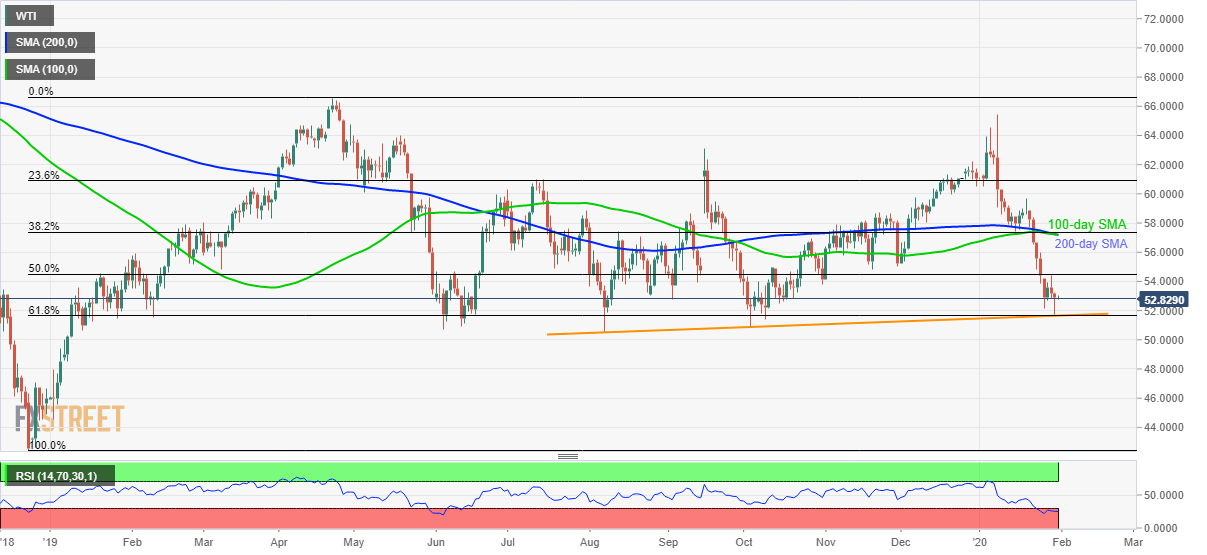
- An ascending trend line since August 2019 and 61.8% of Fibonacci retracement grab the bears’ eyes.
- 100/200-day SMA, 38.2% of Fibonacci retracement offers strong resistance.
WTI trades near $52.90 during Friday’s Asian session. The energy benchmark recently declined to the lowest since October 09 but failed to break the key support confluence as oversold RSI may have triggered the pullback.
Even so, oil prices fail to extend the pullback beyond the immediate resistance, which in turn increases the odds of its another drop to $51.70/65 support confluence including a five-month-old rising trend line and 61.8% Fibonacci retracement of the black gold’s risk from December 2018 to April 2019.
In a case where the sellers keep dominating below $51.65, the year 2019 low surrounding $50.50 and $50.00 round-figure will return to the charts.
On the upside, 50% Fibonacci retracement level of $54.50 acts as the nearby resistance ahead of November 2019 low near $54.85.
However, the quote is less likely to be termed strong, even for short-term, unless it crosses the upper limit of $57.18/38 area including 100 and 200-day SMAs as well as 38.2% Fibonacci retracement.
WTI daily chart
Trend: Pullback expected
