- WTI picks up bids following its bounce off $39.37.
- A clear break of immediate resistance line, now support, joins RSI recovery to favor buyers.
- Fresh selling can wait for a downside break below the 50% Fibonacci retracement level.
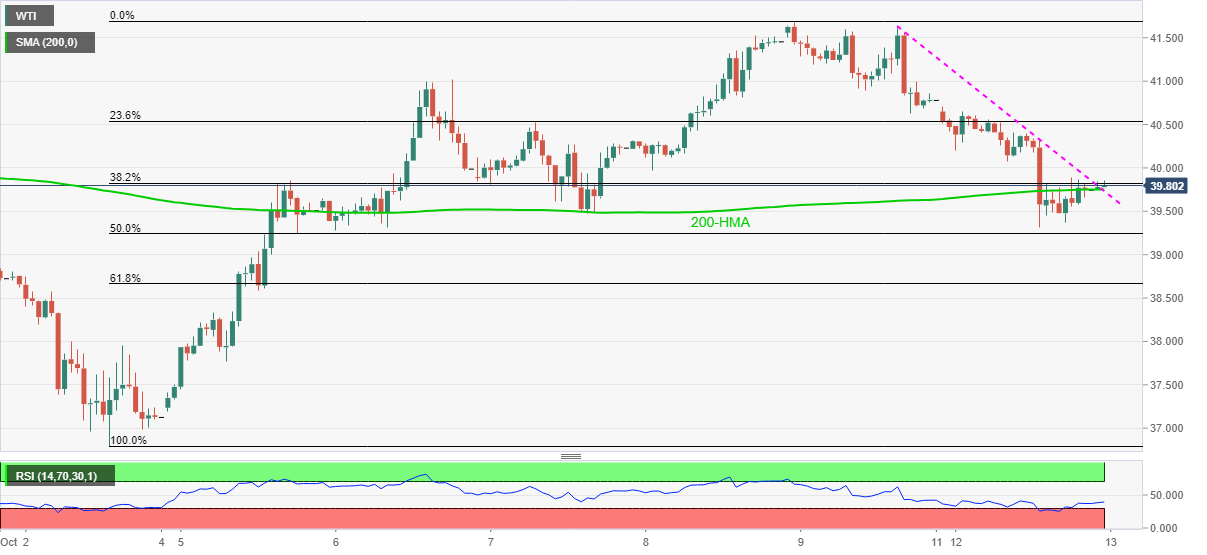
WTI rises to $39.85 during the pre-Tokyo open trading on Tuesday. The energy benchmark recently gained after crossing a descending trend line from Friday amid the RSI’s recovery from the oversold conditions.
However, oil traders await a clear break of the $39.88 recent high to confirm the commodity’s strength above 200-HMA, which in turn will help the quote easily cross the $40.00 round-figure.
During the black gold’s run-up past-$40.00, the October 06 high near $41.00 and the monthly top close to $41.68 will gain the bulls’ attention. Though, $40.50 may offer an intermediate halt during the run-up.
Meanwhile, 50% Fibonacci retracement of October 02-08 upside near $39.25 will probe WTI weakness below the 200-HMA level of $39.75.
In a case where the barrel of black gold weakens below $39.25, the 61.8% Fibonacci retracement level near $38.65 and the $38.00 round-figure may act as buffers before highlighting the monthly bottom close to $36.80 for the bears.
WTI hourly chart
Trend: Pullback expected
