- WTI remains on the back foot while nearing 13-month low.
- Buyers will stay away unless prices settle beyond November month lows.
WTI keeps losses, despite bouncing off the recently flashed 13-month low of $49.77, while taking rounds to $50.00 during Tuesday’s Asian session. Given the black gold’s sustained break below 23.6% Fibonacci retracement of its big fall in the year 2018, coupled with bearish MACD signals, oil prices are likely to remain weak.
That said, early-January 2019 top nearing $49.40 and the late 2018 highs around $47.00 will be on the bears’ radar during the energy benchmark’s further declines.
However, the year 2018 bottom close to 42.50/45 will give chances to buyers for entry.
Meanwhile, a 23.6% Fibonacci retracement level of $50.60 offers immediate resistance ahead of $53.00 and $53.80 upside barriers.
Additionally, buyers will have to re-think on their bullish outlook unless WTI prices break November month low near $54.85.
WTI weekly chart
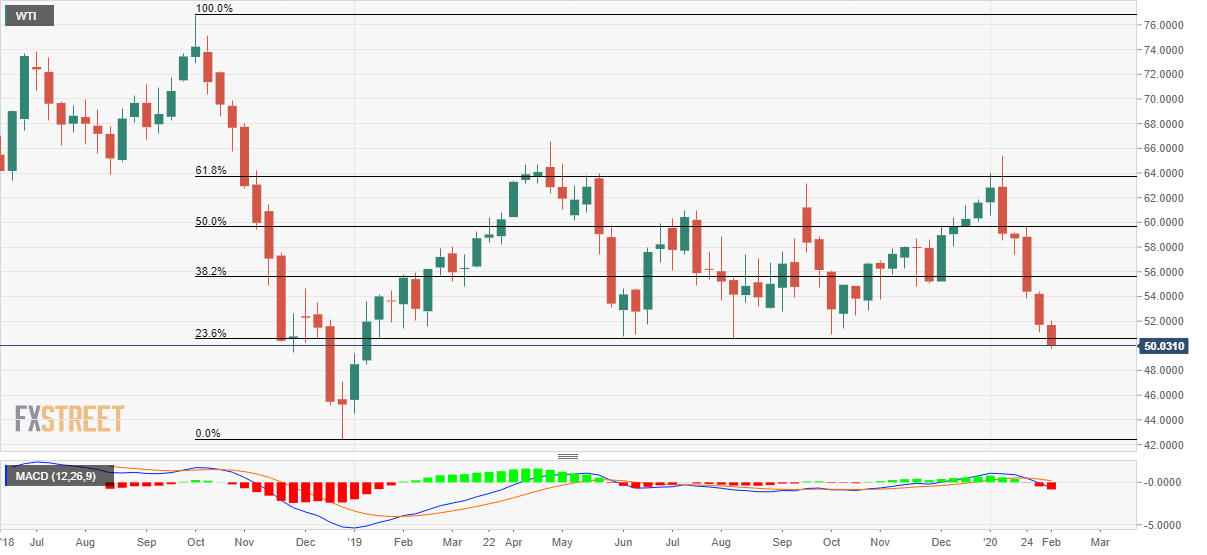
Trend: Bearish
