- Price running close to tough resistance bears looking for a major correction.
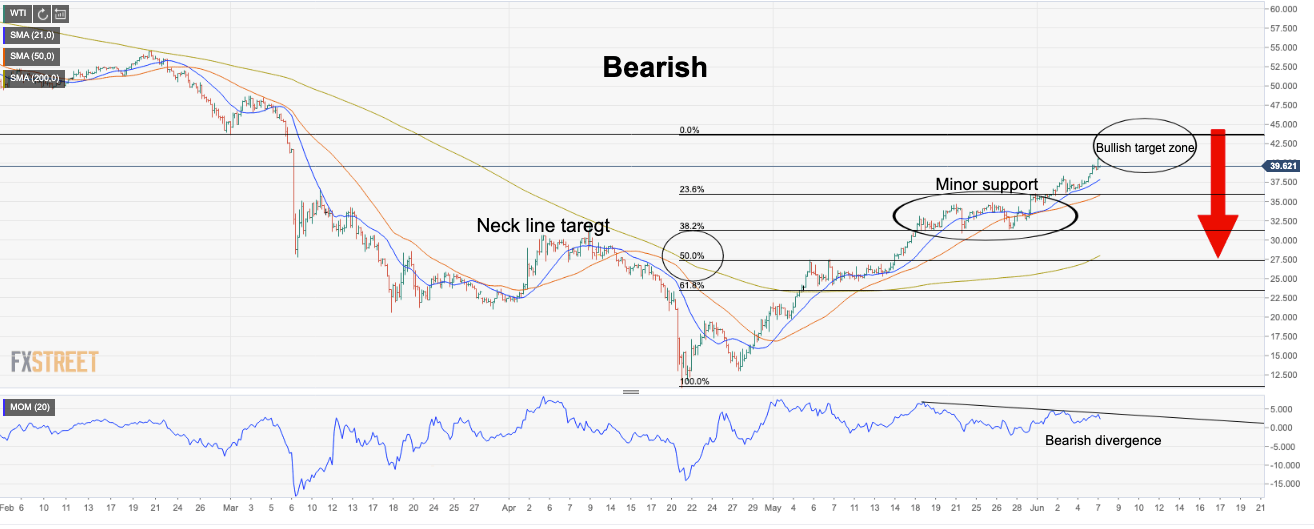
- 61.8% Fib, 200 DMA and prior structure confluence make for string resistance.
- Divergence supports the case for correction of weekly bullish impulse.
WTI has been boosted of late by fundamentals, but how long can the price action withstand an increasingly validated bearish technical landscape?
-
WTI cheers OPEC+ announcement to refresh three-month high above $40.00
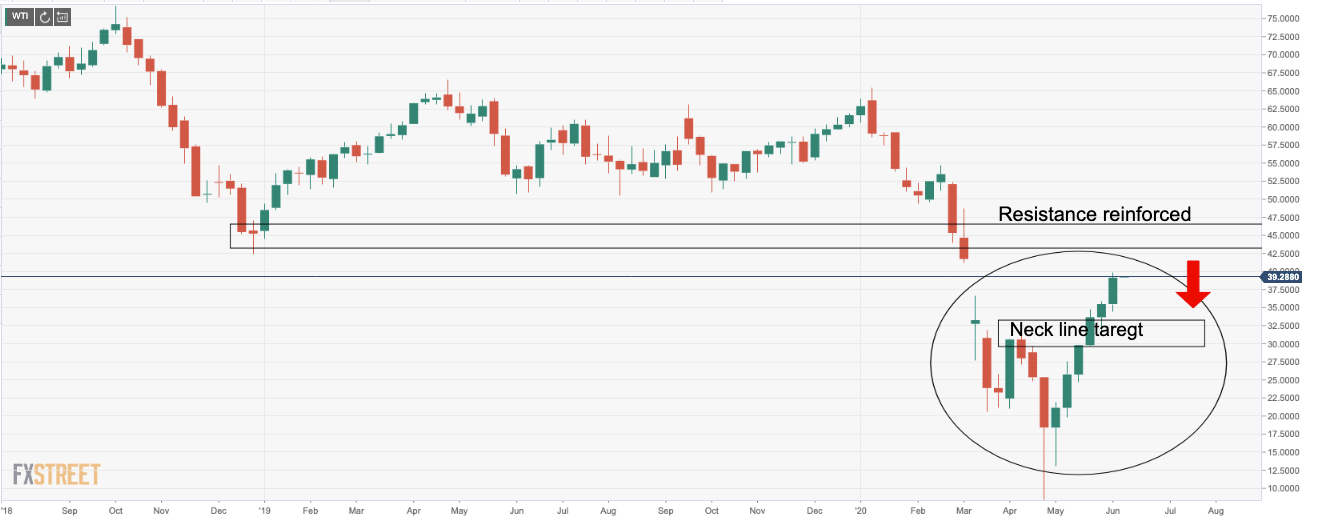
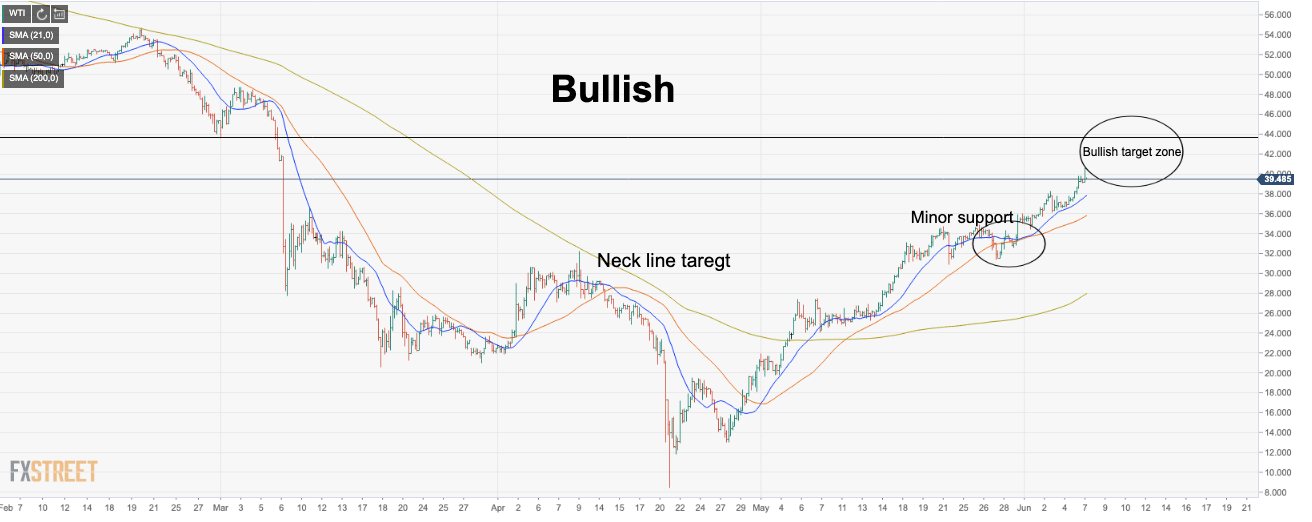
The following charts demonstrate tough monthly resistance overhead and the possibility of a correction back to test prior monthly resistance turned support at the neckline of a W-formation and a high volume node.
Bulls have rallied very close to a 61.8% Fibonacci retracement level, depending on your broker’s charts, the price may already have touched the Fibo.
If there is any upside left, it may only be a handful of dollars left in the bullish outlook at this juncture, IF resistance proves too tough and the fundamentals deteriorate again.
Monthly bearish H&S
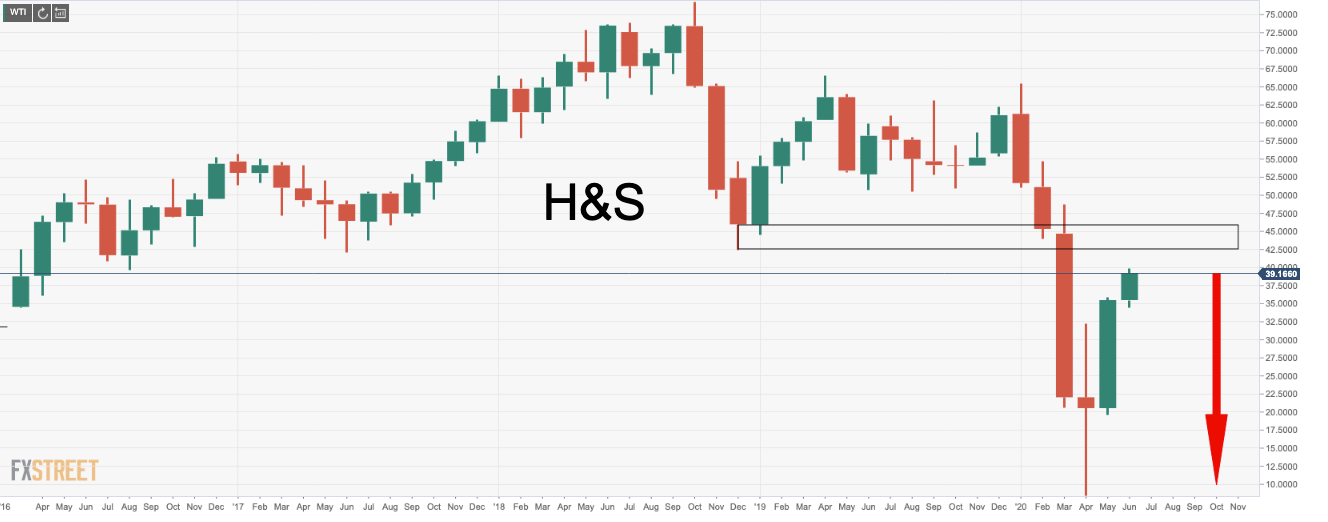
61.8%, prior support of H&S neckline
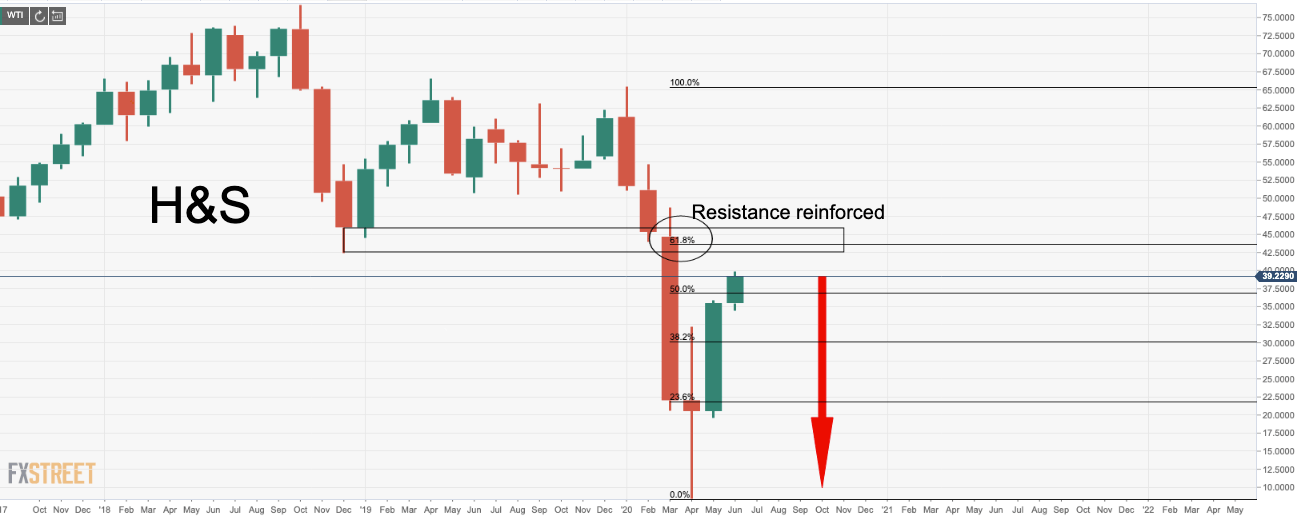
W-formation’s bullish impulse is due for a correction
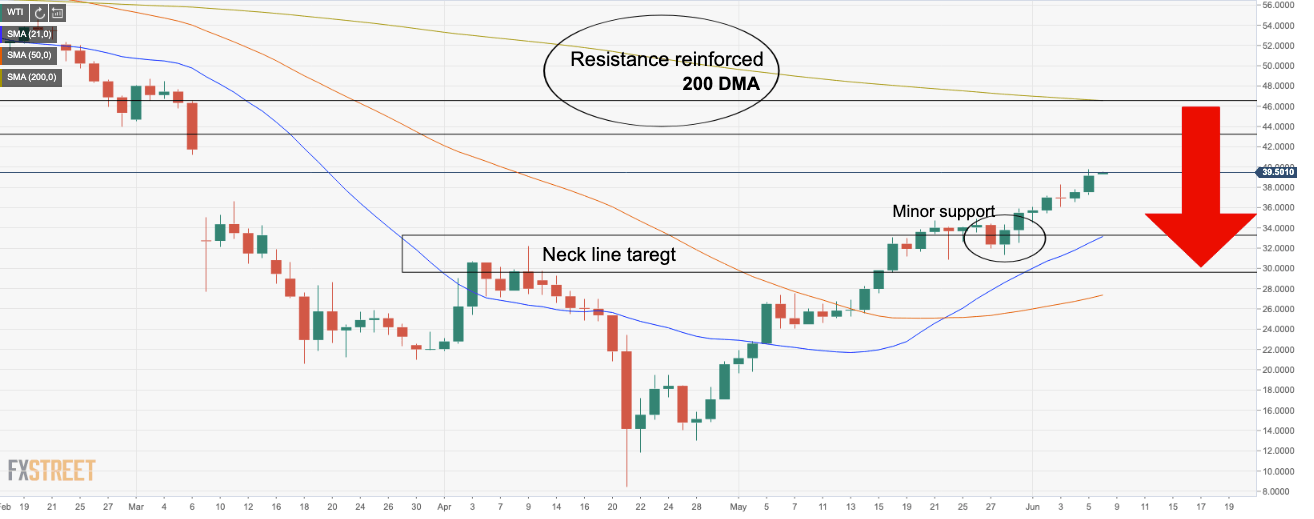
Daily 200 DMA reinforcing bearish bias
Still some upside breathing room to go
Bearish divergence
On the 4HR time frame, sell-entries will need to wait for bearish conditions such as price below 21 moving average.
However, we have bearish divergence on the momentum indicator and a break below minor support and the 38.2% fib retracement, bears can target at least a 50% mean reversion to said W-formation neckline on the monthly chart.
