- WTI extends the four-week losing streak.
- Frequent bounces off 23.6% Fibonacci retracement, amid oversold RSI on the daily chart, favor the pullback.
- The late-October 2019 lows could lure buyers during the short-covering moves.
WTI stays on the back foot while declining to $51.05 during the Asian session on Monday. The energy benchmark has already slipped to the lowest since August 07, 2019. However, the lower band of the Bollinger on the weekly chart, coupled with oversold RSI on daily, signals the quote’s pullback.
In doing so, October 31 low near $53.80 holds the key to pair’s recovery towards the November month lows near $54.85.
Though, the bulls will keep being cautious unless crossing the previous month’s high of $59.60, $60.00 to be on a safer side.
On the flip side, the black gold’s weekly closing below the Bollinger’s lower band, at $50.70, needs to get validation from 23.6% Fibonacci retracement level of October-December 2018 fall, at $50.50 now.
If at all oil prices provide a weekly closing below $50.50, odds favoring further south-run to sub-$50.00 area can’t be denied.
WTI weekly chart
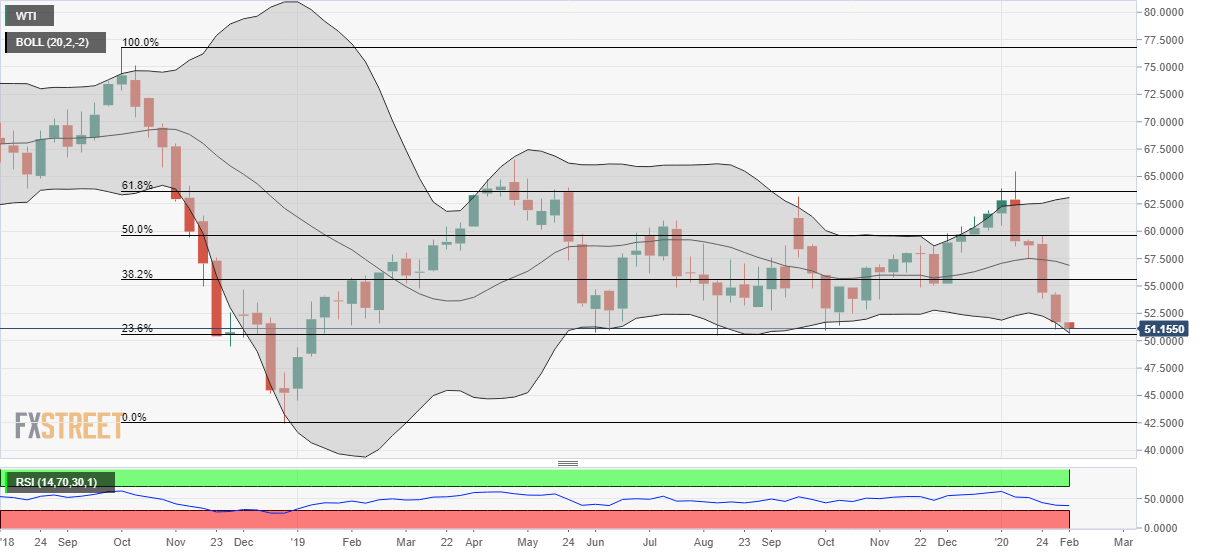
Trend: Pullback expected
