WTI crude bounced from $57.27 on Tuesday, forming a bullish higher low on technical charts. So far, however, the upside has been capped near $58.50.
The multiple hourly candles with long wicks indicate uptrend fatigue. That, alongside an above-70 or overbought reading on the 14-day Relative Strength Index, suggests scope for price pullback.
The ascending 10-day Simple Moving Average (SMA), currently at $55.63, is the support to watch out for in the short-term. A close below the 10-day SMA would invalidate the bullish outlook.
Fundamentals, however, look aligned in favor of a continued rally. According to Wall Street Journal, a faster-than-expected decline in oil inventories accumulated during the coronavirus pandemic is powering the oil rally. Prices have risen by 11% this month.
Further gains may be seen if demand, which has already recovered in India and China, picks up in developed economies. South Korea said early Wednesday that it would release 100 million barrels of oil reserves if there is a supply shortage.
Hourly chart
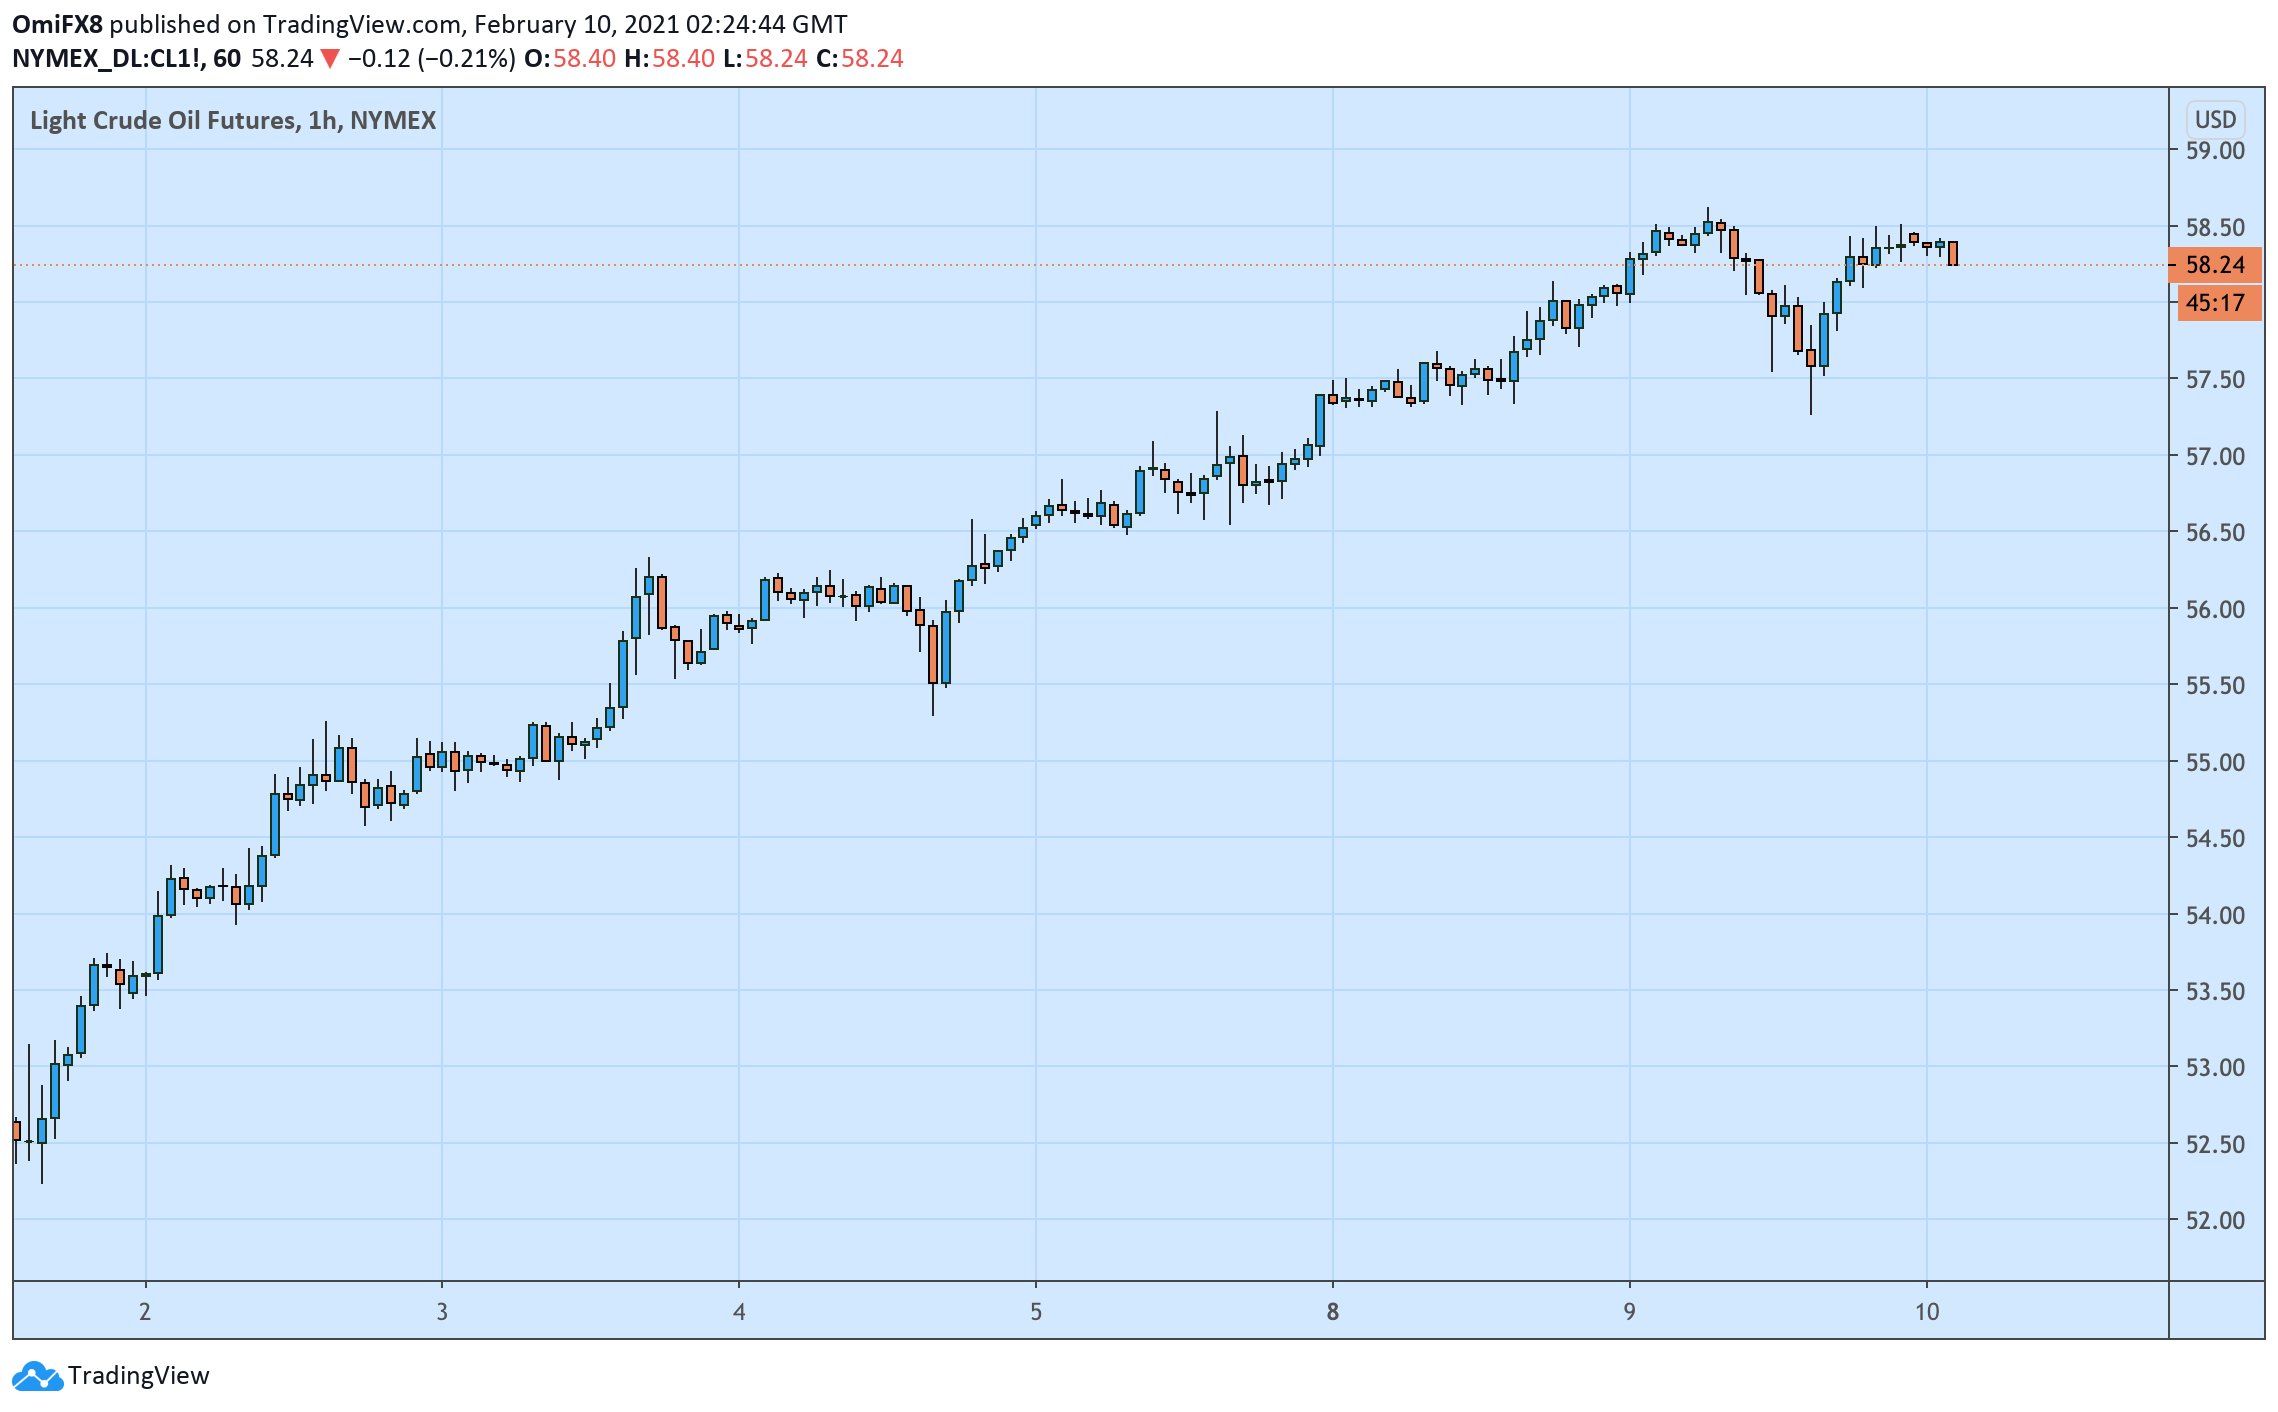
Trend: Bullish
Technical levels
