- WTI recovers the early-day losses while bouncing off the key Fibonacci retracement level.
- Buyers will look for entry beyond short-term falling resistance line.
- Oversold RSI can keep challenging the bears.
Following its drop of more than 7.0% during the Asian session, WTI retraces losses to 4.6% while trading around $31.90 ahead of the European session on Thursday.
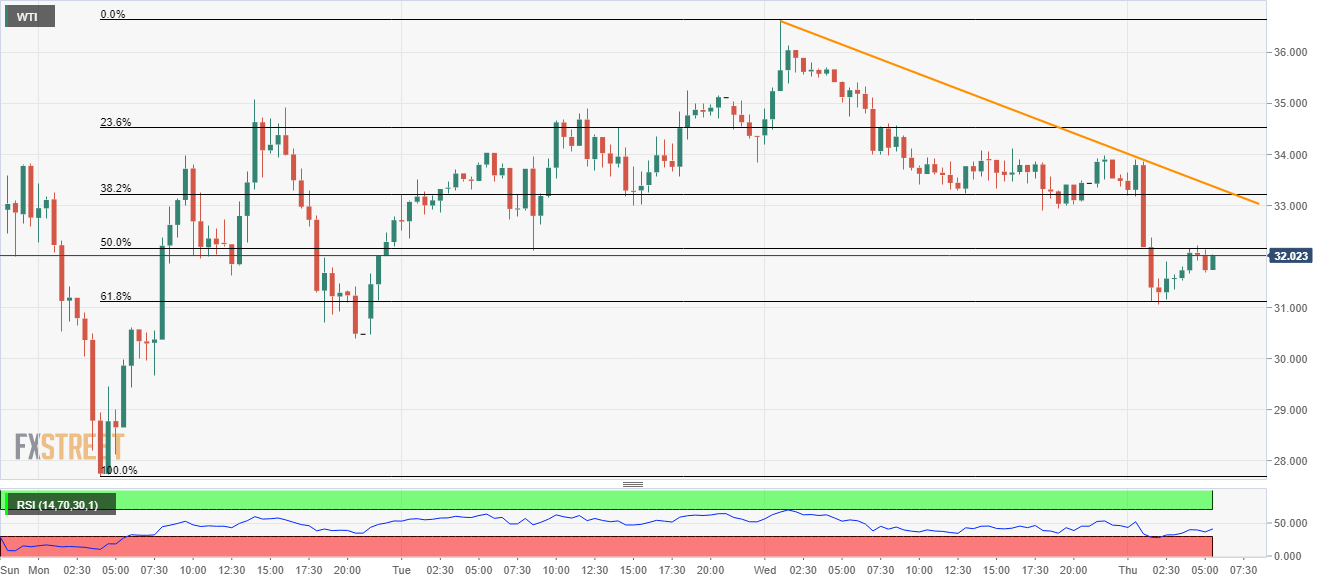
In doing so, the energy benchmark stays above 61.8% Fibonacci retracement of its pullback moves from Monday’s flash- crash low. However, a downward slopping trend line connecting Wednesday’s top to the latest, at $33.40, question the latest U-turn.
Should the oil prices rise beyond $33.40, $35.00 can offer an intermediate halt during the run-up to the weekly top near $36.60.
It is worth mentioning that oversold RSI conditions favor short-term pullback of the black gold.
Meanwhile, a downside break of 61.8% Fibonacci retracement, around 31.10, can take rest near $30.00 before diving deeper towards Monday’s low near $27.70.
WTI 30-minute chart
Trend: Pullback expected
