- WTI extends recovery from the multi-week low.
- Bearish MACD questions buyers but trend line break and a bounce from the key support favor the pullback.
WTI takes the bids to $51.33 during the Asian session on Thursday. The energy benchmark repeated the bounce off $49.40/50 support-zone as well as cleared the four-week-old resistance line, now support, during the previous day.
Buyers are now looking forward to January 29 high near $54.40 and 21-day EMA near $54.55 during the quote’s further upside.
However, lows marked during November 2019 will keep the black gold’s further upside capped near $54.85-$55.00
Alternatively, November 2018 low, high marked on January 04, 2019 and Wednesday’s bottom together constitute $49.50/40 as the key support.
Should bears manage to defy $49.40, late-December 2018 top surrounding $47.00 will return to the chart.
WTI daily chart
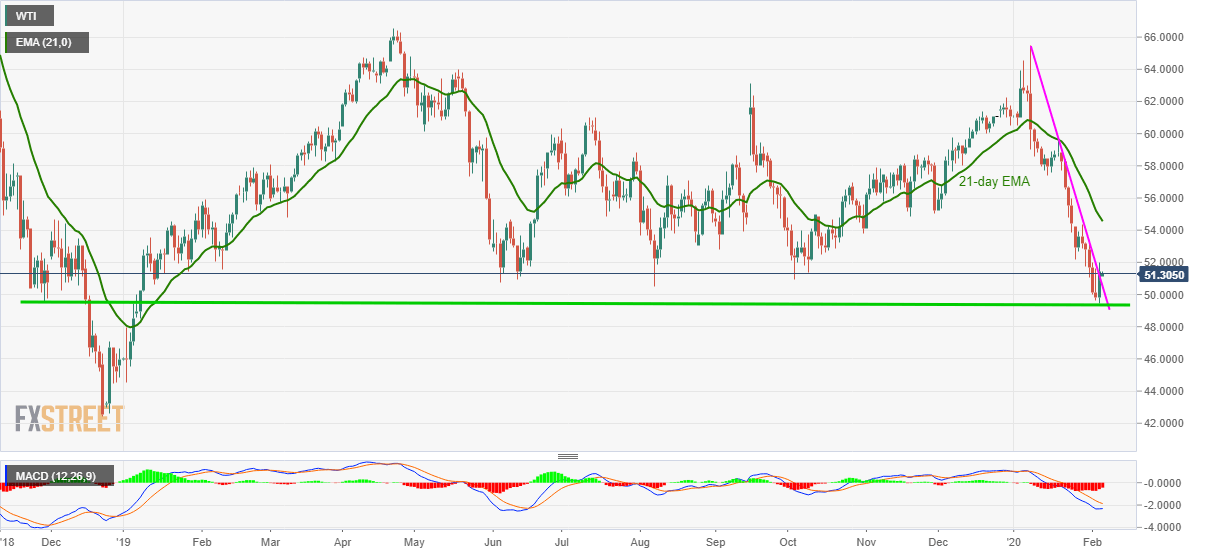
Trend: Further recovery expected
