- WTI refreshes intraday low, stays depressed for third consecutive day.
- Bearish MACD, sustained break of short-term support direct sellers toward 200-bar SMA.
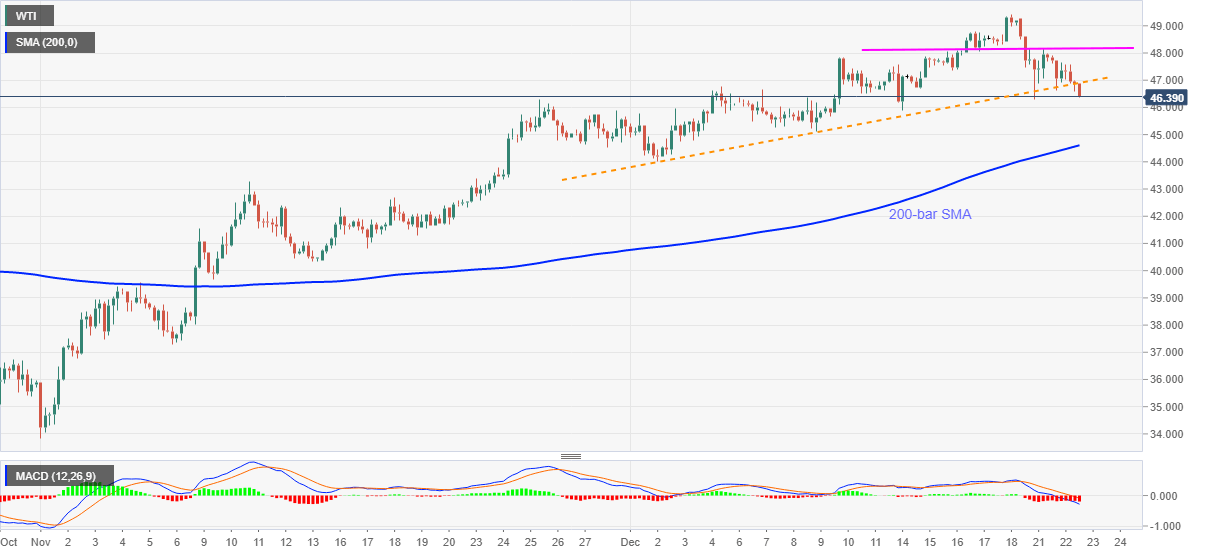
- Bulls look for clear trading above $48.00 for fresh entries.
WTI takes offers around $46.40, down 1.38% intraday, during the early Wednesday. The energy benchmark extends the previous two day’s losses to the lowest in seven days after breaking an upward sloping trend line from December 02.
Other than the trend line breakdown, bearish MACD also favors the oil sellers targeting 200-bar SMA, at $44.60 now. However, any more downside will be challenged by the monthly low near $44.00.
In a case where the black gold remains pressured below $44.00, November 11 high near $43.30 can also act as a downside filter.
Meanwhile, multiple tops marked in one week around $48.00 highlight the horizontal line as the key upside hurdle even as the quote jumps back beyond the previous support line around $46.90.
Following that, the WTI buyers can eye to refresh the monthly top of $49.43, also the highest since late February, while eyeing the $50.00 threshold.
WTI four-hour chart
Trend: Further weakness expected
