- WTI remains depressed after taking a U-turn from $41.99.
- Weekly falling channel follows the run-up from June 21 to portray bullish chart pattern.
- $40.45 becomes the key support followed by 200-bar SMA.
- February 2020 lows lure the bulls beyond $42.00.
WTI drops to $41.53, down 0.37% on a day, ahead of the European session on Tuesday. Even so, the black gold portrays a bullish chart formation on the four-hour (4H) chart while considering its rise from June 21 and the recent pullback from $42.52. Also increasing the odds of a bounce is the MACD conditions that flirt with the bulls by the press time.
As a result, the quote’s current weakness is less likely to cause any troubles for the bulls unless breaking $40.45, comprising the flag’s support and a five-week-old ascending trend line.
Also acting as a downside filter is a 200-bar SMA level of $39.86 and July 10 bottom surrounding $37.80.
Meanwhile, the energy benchmark’s sustained rise past-42.00 will have to refresh the monthly top beyond $42.52 to attack February month’s low near $44.00.
WTI four-hour chart
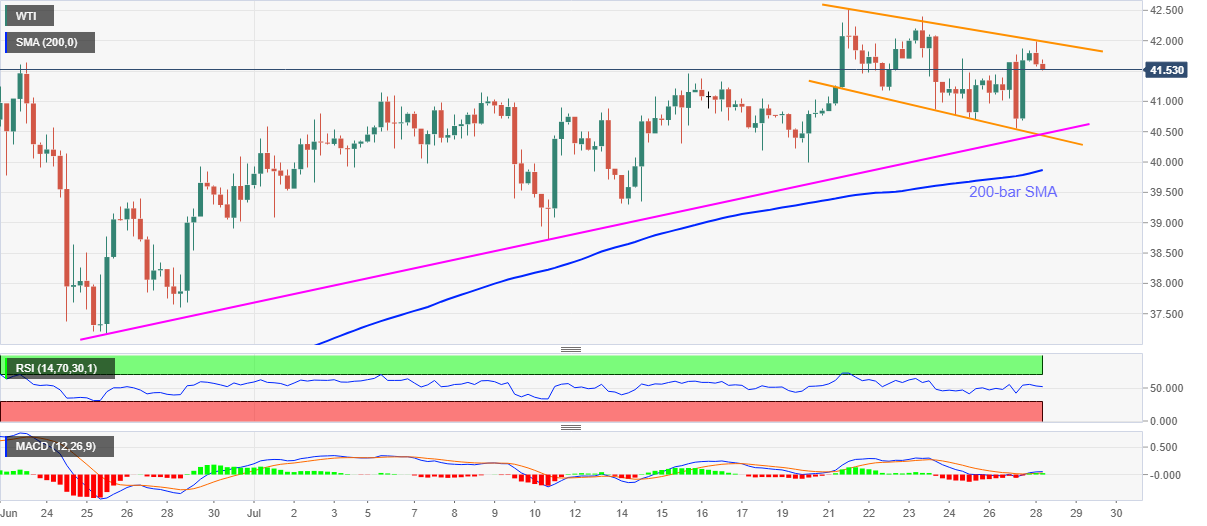
Trend: Bullish
