- WTI stays firm around one-month top, confronts seven-week-old horizontal resistance.
- Bullish MACD, sustained trading above 21-day SMA favor bulls.
- 2.5-month-old ascending trend line adds to the support.
WTI picks up bids to $63.45 during the four-day run-up that probes March 18 top by the press time of Friday’s Asian session.
While the strongest bullish signals from MACD since mid-February backs the oil benchmark’s latest run-up, a horizontal line comprising multiple levels marked since February 25, around $63.70-75, tests the buyers off-late.
It should, however, be noted that a clear break above $63.75 won’t hesitate to propel the black gold towards $66.50 ahead of challenging March’s peak surrounding $67.85.
Alternatively, pullback moves become less challenging to the prevailing bullish trend until breaking the 21-day SMA level of $60.43.
Also giving hopes to the WTI bulls is an ascending support line from February and the previous month’s low, respectively around $58.85 and $57.25.
WTI daily chart
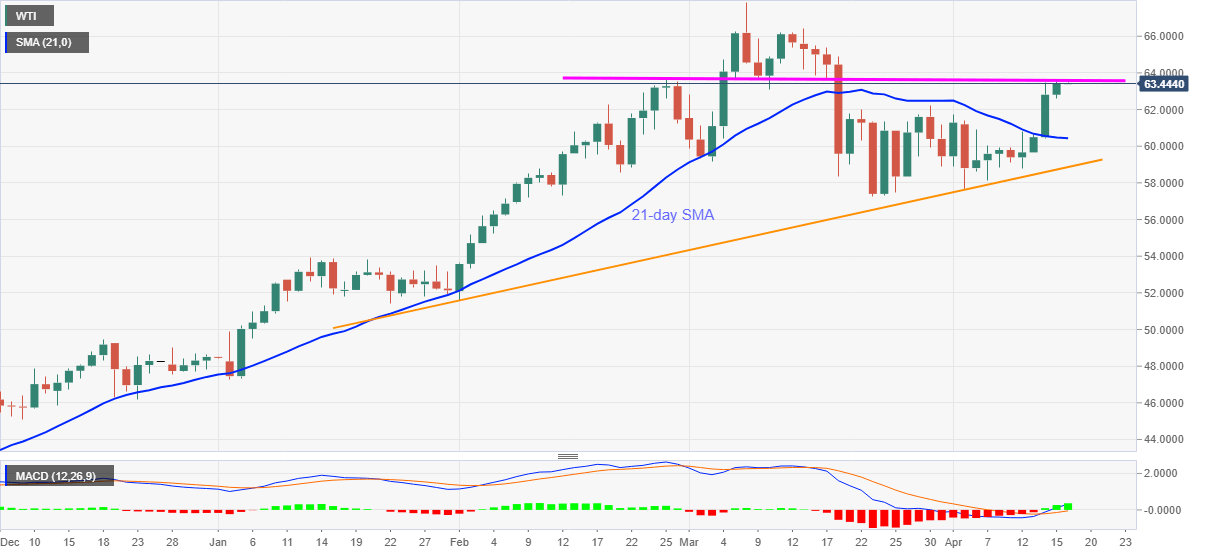
Trend: Bullish
