- WTI holds wavers around intraday high while flashing mild gains.
- Strong RSI, likely shift in MACD signals also favor energy buyers above short-term key moving average.
- $49.00 holds the key to monthly high during the further run-up.
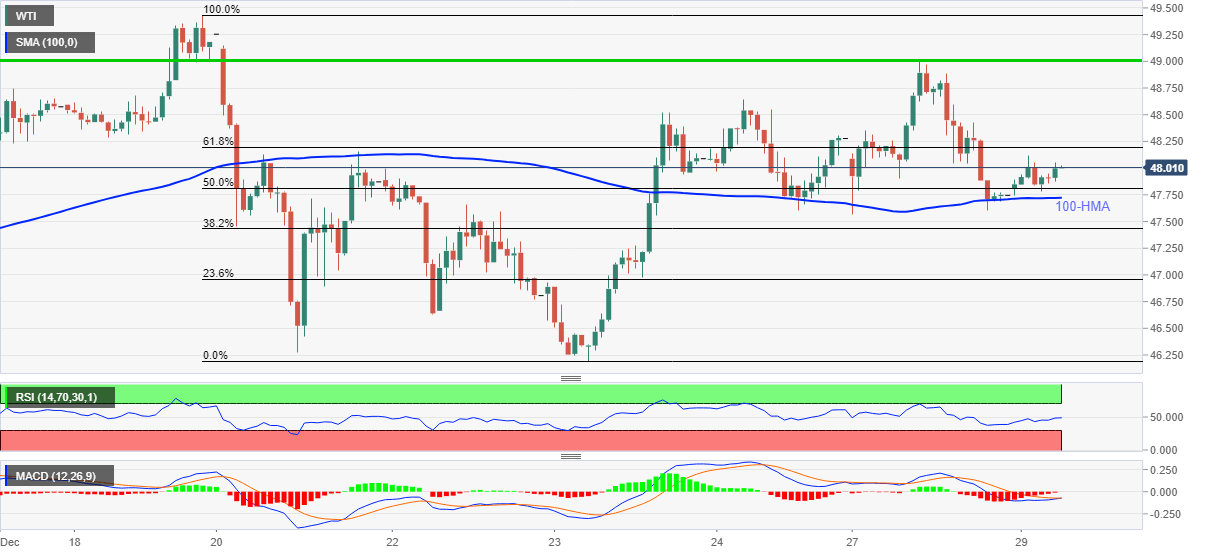
WTI prints 0.55% gains while taking rounds to $48.00 ahead of Tuesday’s European session. In doing so, the energy benchmark keeps 100-HMA as the key support while respecting signals from RSI and the MACD.
That said, the black gold currently aims 61.8% Fibonacci retracement of its December 18-23 downturn, around $48.20, a break of which will propel the quote towards the weekly high, as well as multiple lows marked on December 18, near $49.00.
If at all the commodity bulls manage to cross the $49.00 threshold, the monthly peak and early February lows near $49.40/45 hold the keys to the further upside towards the $50.00 round-figure.
Meanwhile, a downside break of 100-HMA, currently near $47.70, can have $47.50/55 as an intermediate before eyeing the $47.00 support.
In a case where the oil sellers keep reins past-$47.00, $46.60 and the December 23 bottom surrounding $46.20 can return to the chart ahead of highlighting the monthly low near $44.00.
WTI hourly chart
Trend: Bullish
