- WTI eases from the key SMA after refreshing three-day top.
- Bearish MACD, strong resistance test the bounce off 61.8% of Fibonacci retracement.
WTI bulls catch a breather around $37.30/25 ahead of Tuesday’s Tokyo open. The energy benchmark registered notable recoveries after dropping to the May 29 low during the previous day.
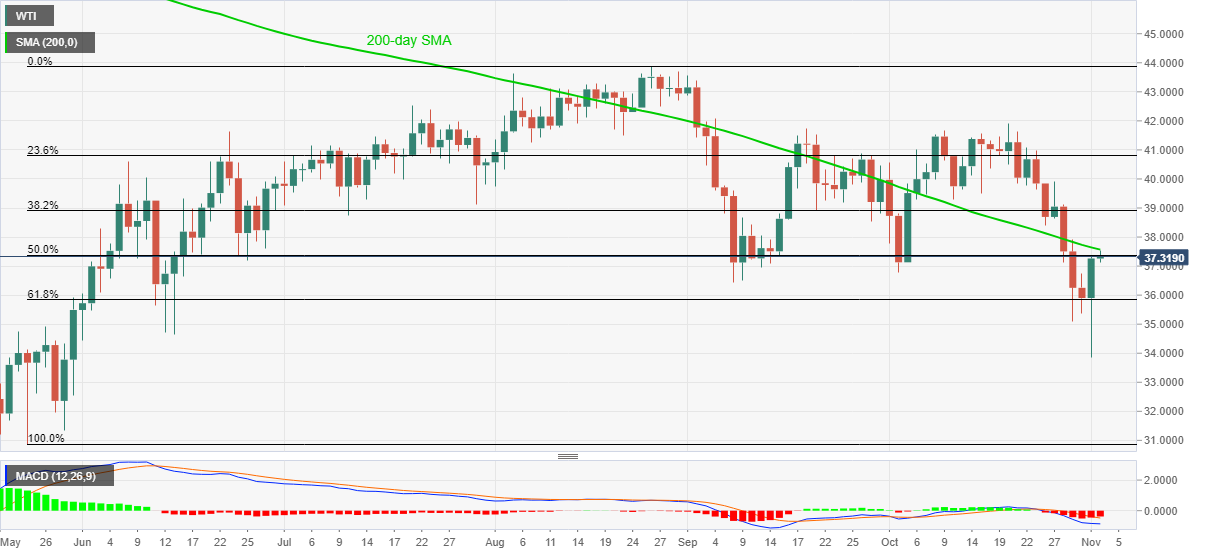
Even so, 200-day SMA, currently around $37.55/60, restricts the black gold’s immediate upside amid the bearish MACD signals. Further, the quote also struggles around 50% Fibonacci retracement of May 22 to August 26 upside, near $37.35, by press time.
Hence, a pullback towards revisiting the September month’s low of $36.43 can’t be ruled out. Though, any more declines will have to provide a daily closing below the 61.8% Fibonacci retracement level of $35.83.
Alternatively, a daily close beyond the 200-day SMA level of $37.57 will escalate the commodity’s recovery moves towards the early-October lows near $39.30 ahead of highlighting the $40.00 round-figures for the oil bulls.
In a case where the rise crosses the $40.00 threshold, the previous month’s high of $41.92 will be the key to watch.
WTI daily chart
Trend: Pullback expected
