- WTI extends recovery gains towards 100-HMA.
- The resistance-turned-support, coupled with 23.6% Fibonacci retracement, limit immediate downside.
- 200-HMA, 61.8% Fibonacci retracement add to the resistance.
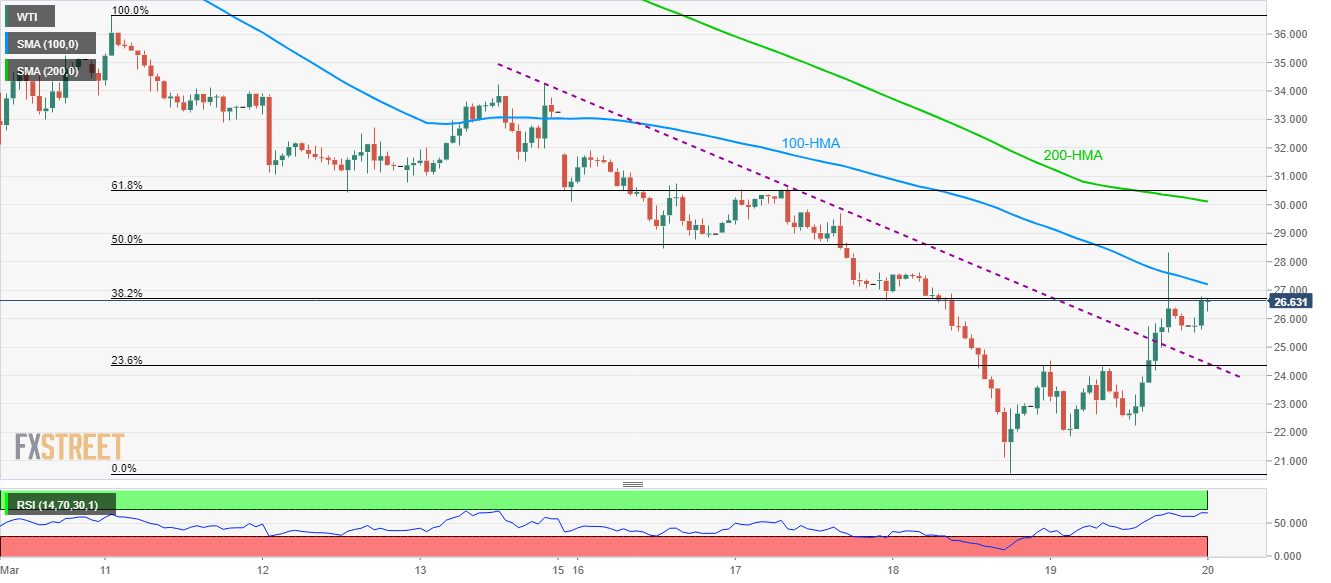
While keeping its break of the weekly resistance line, now support, WTI rises 3.0% to $26.50 by the press time of Friday’s Asian session.
The energy benchmark now aims to confront 100-Hour Simple Moving Average (HMA), currently near $27.20, whereas 50% Fibonacci retracement of March 11 to 18 fall, near $28.60, can please buyers afterward.
In a case where the oil prices manage to cross $28.60, 200-HMA and 61.8% Fibonacci retracement, close to $30.10 and $30.50 respectively, will challenge the bulls.
Alternatively, the resistance-turned-support line and 23.6% Fibonacci retracement, near $24.40/30, could restrict the black gold’s nearby declines.
If at all the bears sneak in around $24.30, $21.90 and $20.60 hold the key to further drops towards $20.00.
WTI hourly chart
Trend: Further recovery expected
