- WTI snaps the two-day declines, remains range-bound.
- 100-bar SMA, 61.8% Fibonacci act as the key resistance confluence.
- Multiple downside supports, bullish MACD keeps buyers hopeful.
Despite being inside the two-day-old symmetrical triangle, WTI marks 0.45% gains to $47.40 amid the Asian session on Thursday.
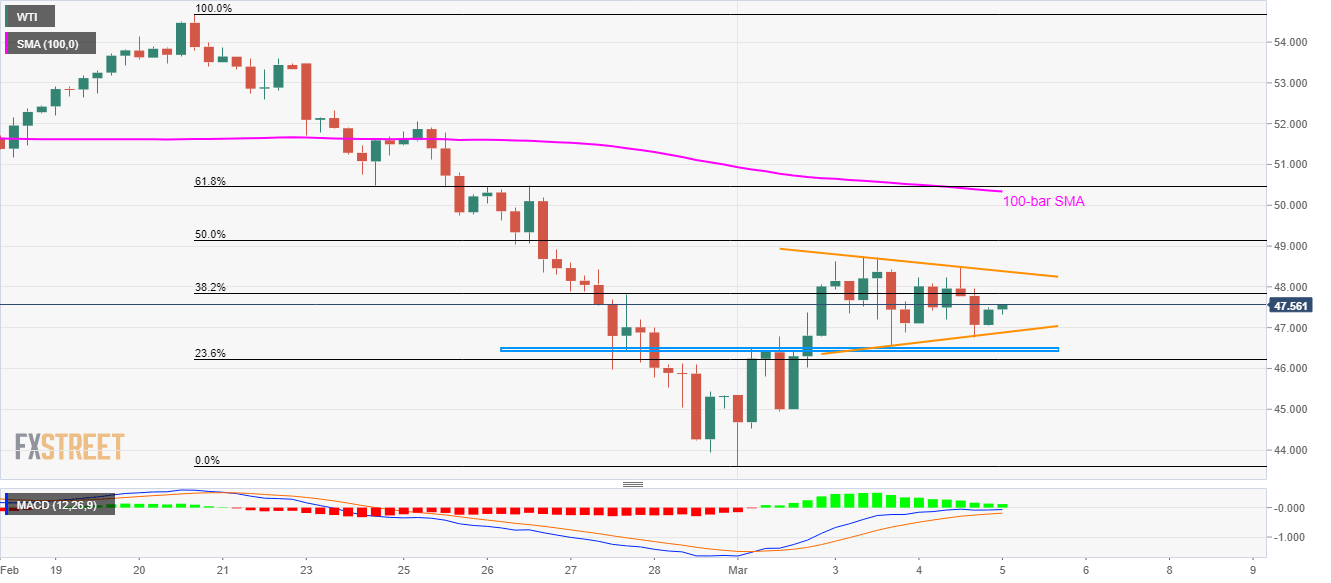
While $48.40-$46.80 area restricts the black gold’s short-term moves, bullish MACD, as well as multiple supports around $46.57/40, favors the buyers.
As a result, an upside break of $48.40 will push the bulls towards 50% Fibonacci retracement of February 20 to March 01 fall, near $49.15.
However, a confluence of 100-bar SMA and 61.8% Fibonacci retracement around $50.33/45 can question the energy benchmark’s further advances.
It’s worth mentioning that the oil price declines below $46.40 might not refrain to drag it towards monthly lows surrounding $43.60.
WTI four-hour chart
Trend: Sideways
