- WTI extends pullback from late January 2020 top.
- Overbought RSI, bearish candlestick suggests short-term pullback.
- Bulls need to overcome $59.30 hurdle to regain confidence.
WTI stays on the back foot near $58.25 while extending declines from an 11-month top during the initial Asian session trading.
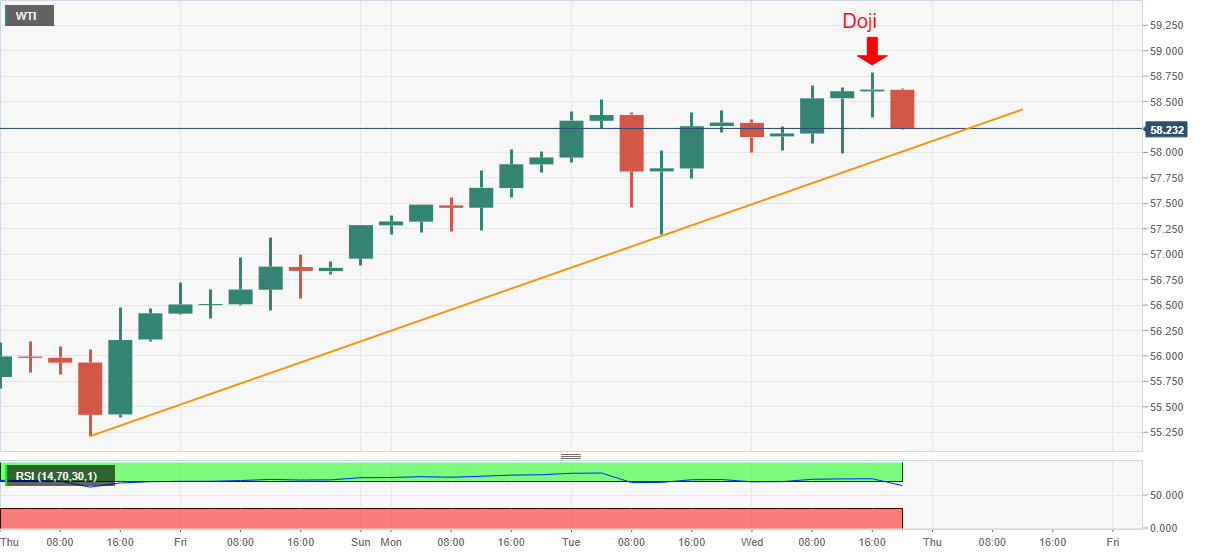
In doing so, the oil benchmark justifies the Doji candlestick formation on the four-hour (4H) chart at the multi-day peak when RSI is overbought.
As a result, the commodity sellers are targeting an upward sloping trend line from February 04, currently around $58.00, during the further downside.
However, any extra weakness past-$58.00 will have to break Tuesday’s low of $57019 to direct the WTI bears toward the monthly low of $51.60.
On the flip side, a clear break of the previous day’s high, also the highest since early 2020, of $58.79 will have to cross the 59.00 threshold before eyeing the January 20 top near $59.30.
It’s worth mentioning that the $60.00 psychological magnet will add filters to the WTI run-up towards the previous yearly peak surrounding $65.50 if it manages to stay beyond $59.30.
WTI four-hour chart
Trend: Pullback expected
