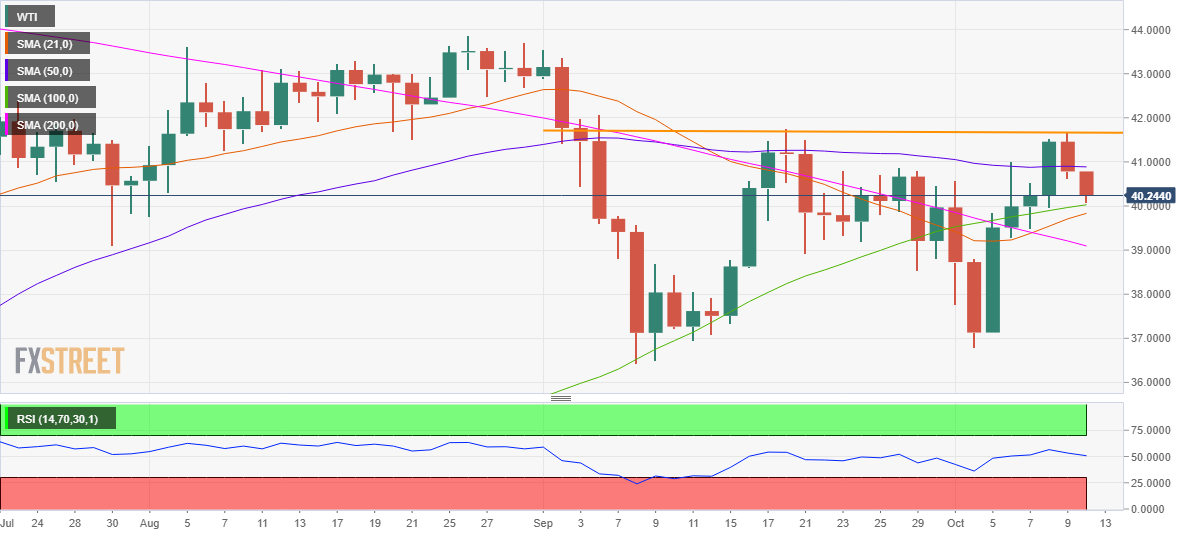
- WTI sees bearish reversal after double top formed on daily sticks.
- Daily RSI points south while off the bearish region.
- 100-DMA at 40.03 to challenge bears’ commitment.
WTI (futures on NYMEX) extends its run of losses into a second straight day on Monday, in the face of a bearish reversal, which ensued after the price formed a double top formation on the daily chart.
The US oil faced rejection around 41.70 on September 18 and October 9, carving out a double top pattern. On its way south, the WTI barrel breached the 50-daily moving average (DMA) at 40.88 and now looks to test the next critical support of the 100-DMA at 40.03.
Acceptance under the 100-DMA could call for a test of the upward-sloping 21-DMA at 39.83. The next downside target is aligned at 39.09, which is the 200-DMA support.
On the flip side, the bulls need to recapture the 50-DMA support-turned-resistance to challenge the horizontal trendline (orange) barrier at 41.70.
The 14-day Relative Strength Index (RSI) points south, still holds above the midline, suggesting that the bearish bias could be losing momentum in the near-term.
WTI daily chart
WTI additional levels
