- WTI prints a head-and-shoulders pattern on the hourly chart.
- Acceptance below the neckline support would confirm bearish reversal.
Oil prices are flashing red in Asia and look to be forming a major bearish reversal technical pattern.
At press time, West Texas Intermediate (WTI) crude is trading at $38.48, representing a 2.83% decline on the day, having hit highs near $40 on Wednesday.
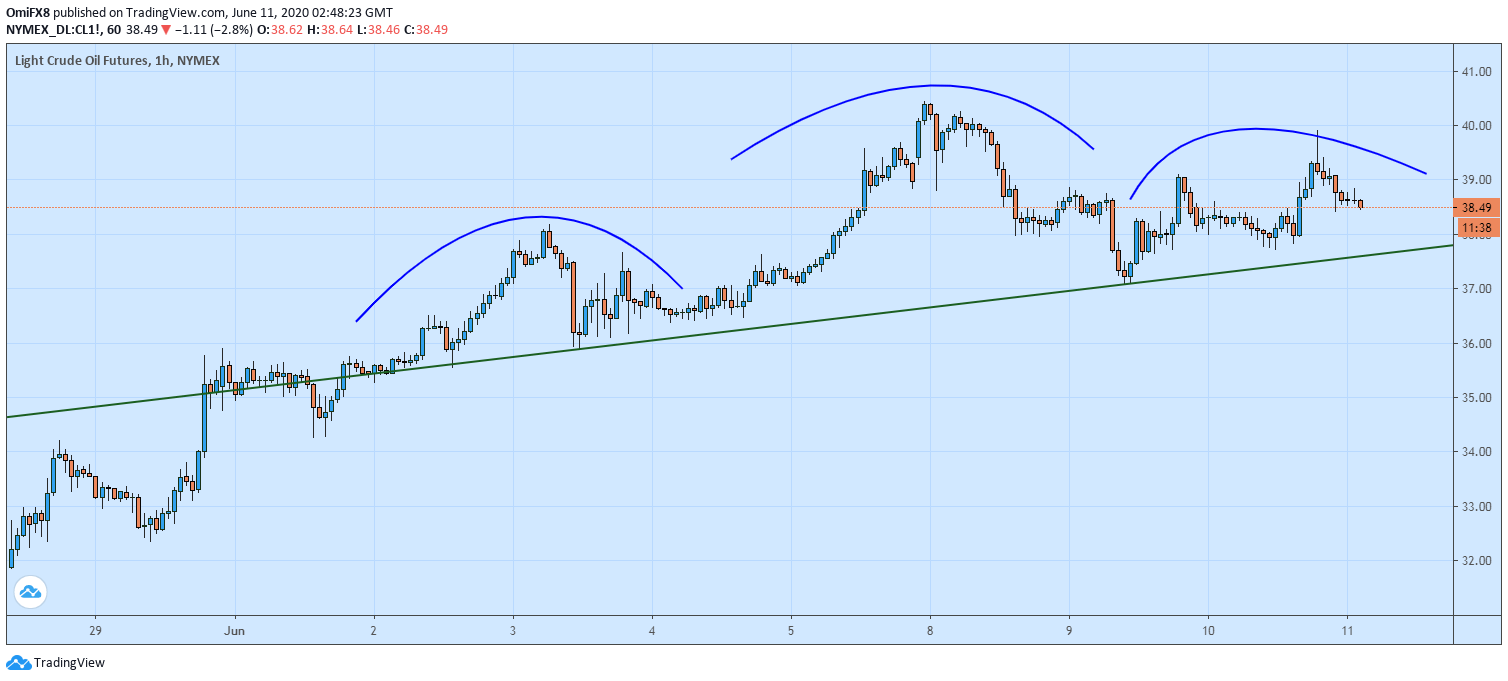
The black gold has been largely restricted to a narrow trading range of $37 to $40.50 and the consolidation looks to have taken the shape of a head-and-shoulders pattern on the hourly chart. With the pullback from Wednesday’s high of $40, WTI seems to be charting the right shoulder of the head-and-shoulders pattern.
A break below the neckline support at $37.59 would confirm a head-and-shoulders breakdown and create room for a decline to $34.75 (target as per the measured move method).
On the higher side, Wednesday’s high of $39.91 is the level to beat for the bulls. A violation there would expose the recent high of $40.50.
Hourly chart
Trend: Bearish
Technical levels
