- WTI holds onto recovery gains, stays below 21-day EMA.
- A bearish candlestick formation continues highlighting downside risks.
- Mid-January lows could lure buyers during the successful rise.
WTI rises to $52.40 during Wednesday’s Asian session. Even so, the black gold stays below 21-day SMA while a bearish candlestick formation keeps the sellers hopeful.
That said, $51.00 can act as immediate support during the pullback whereas the monthly bottom surrounding $49.40 could gain market attention afterward.
If at all oil prices slip below $49.40, late-October 2017 low near $49.00 might return to the chart.
Meanwhile, the oil benchmark’s ability to cross the 21-day EMA level of $52.91 defies the bearish candlestick formation.
In doing so, January 29 high of $54.37 and January 15 low nearing $57.40 can flash on the bull’s radar.
WTI daily chart
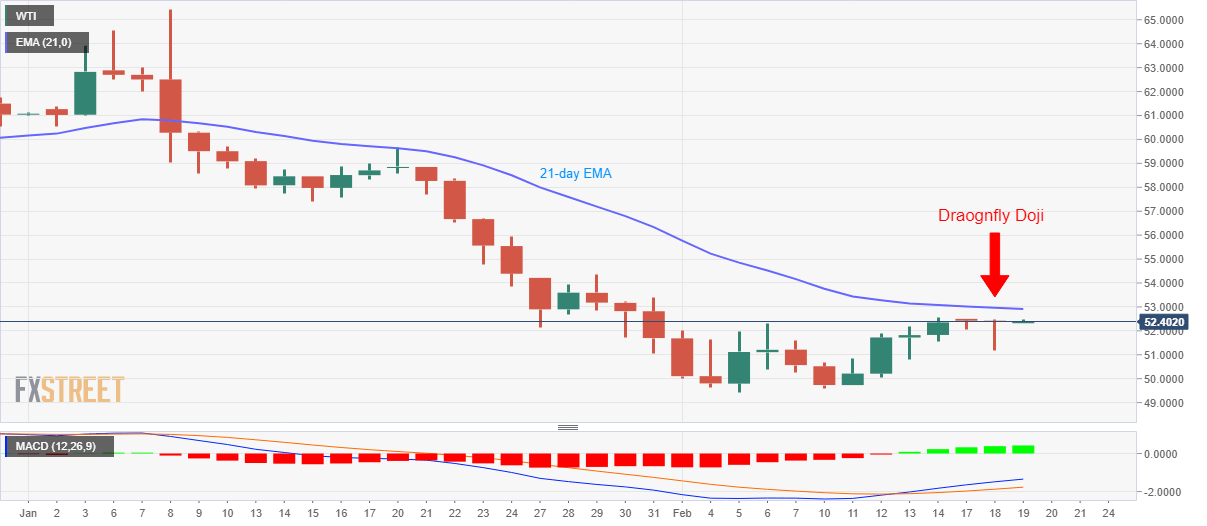
Trend: Bearish
