- WTI recedes from intraday high while keeping mild gains.
- Bullish chart pattern, sustained trading above key HMAs and strong RSI favor buyers.
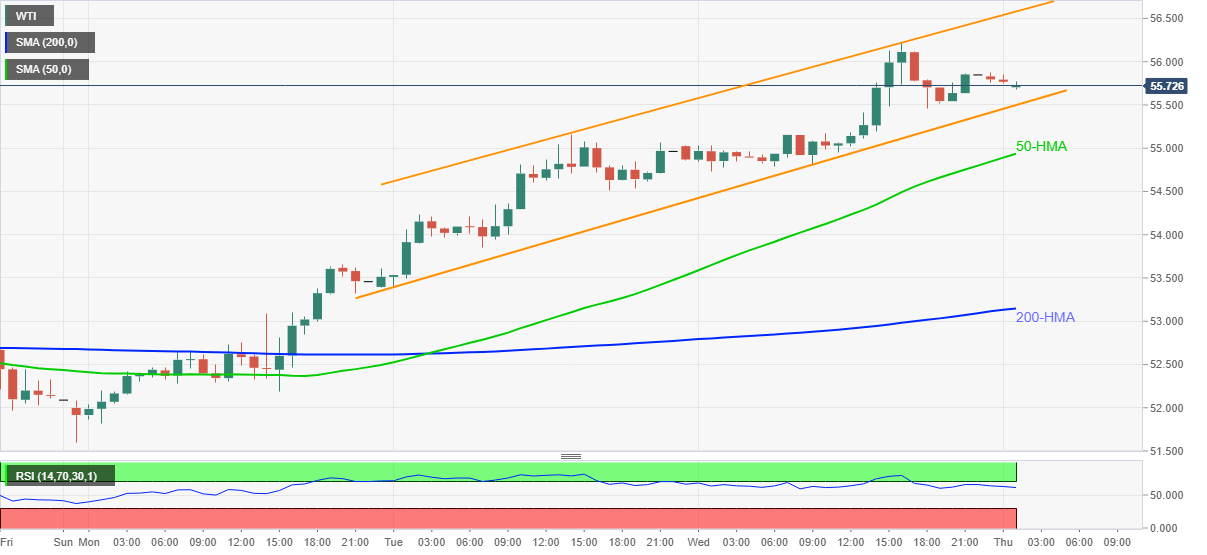
- Mid-January 2020 low lures the bulls beyond trend channel resistance.
WTI drops to $55.72 while trimming the initial Asian session gains to +0.17% on a day during early Thursday. Even so, the black gold stays positive for the fourth consecutive day while taking rounds to the highest since late January 2020 levels.
Also portraying the strength of the energy benchmark is the three-day-old rising channel and the quote’s successful trading above the key Hourly Moving Averages (HMAs) amid strong RSI conditions.
As a result, the latest pullback is likely to stop around the stated channel’s support line near $55.50. Though, any further downside will not hesitate to probe the 50-HMA level of $54.93.
It should, however, be noted that any further weakness below $54.93 should drag WTI towards 200-HMA, currently around $53.15.
Meanwhile, the recent multi-month high of around $56.25 and the upper line of the channel near $56.60 can entertain intraday buyers of the oil benchmark.
During further upside past-$56.60, January 15, 2020 low near $57.42 will be the key to watch.
WTI hourly chart
Trend: Bullish
