- WTI stays pressured after easing from $61.32 the previous day.
- Bearish MACD, key resistance confluence challenge short-term upside.
- 50-day EMA adds to the downside filters, $63.00 offers extra resistance.
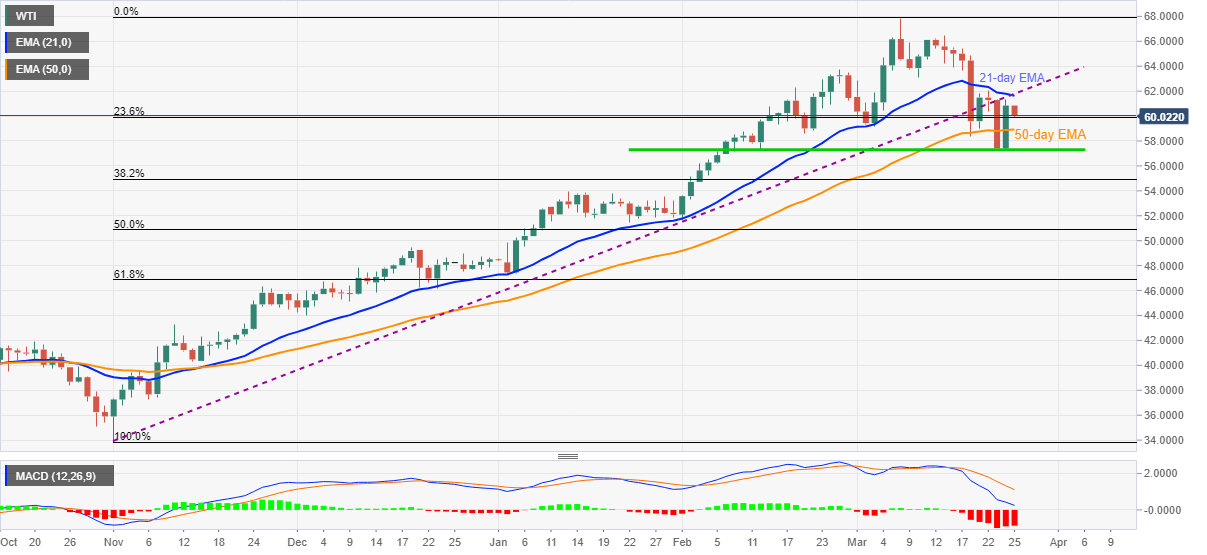
WTI remains depressed around $60.00, down 1.24% intraday, during early Thursday. In doing so, the energy benchmark extends the previous day’s U-turn from $61.34 while keeping the downside break of an ascending support line now, resistance, from November 02 and 21-day EMA.
Given the bearish MACD joining the black gold’s sustained trading below the key resistance convergence, WTI sellers eye a 50-day EMA level of $58.93 on the desk as a short-term target.
It should, however, be noted that the quote’s weakness below important EMA will have to defy the horizontal area including multiple levels marked since early February, around $57.30-25.
If at all, the oil prices drop below $57.25, January top near $53.90 should return to the chart.
On the contrary, an upside break of $61.60-80 resistance confluence will be a trigger for the fresh rise targeting $63.00-$63.10 area comprising March 10 low and late February tops.
During the quote’s sustained rise past-$63.10, WTI may not hesitate to refresh the monthly peak surrounding $67.90.
Overall, the commodity is in consolidation mode after a stellar run-up since November.
WTI daily chart
Trend: Pullback expected
