- WTI prints mild losses after stepping back from $40.76 the previous day.
- 100-day EMA, bullish MACD challenge oil sellers ahead of the weekly low.
- 61.8% Fibonacci retracement, one-month-old horizontal line can question bulls.
WTI drops to $40.39, down 0.11% intraday, during the early Wednesday. The energy benchmark justifies its Monday’s pullback from 100-day EMA with notable gains on Tuesday. However, the latest consolidation in the commodity prices doubts the MACD conditions.
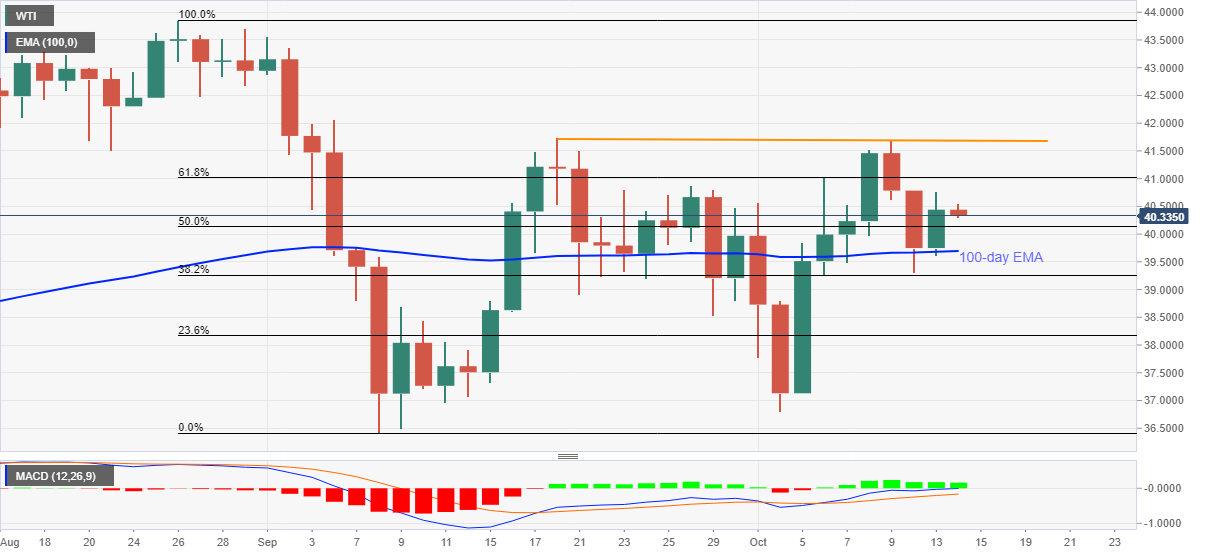
As a result, the 50% Fibonacci retracement of August 26 to September 08 downside, near $40.13, followed by the $40.00, can challenge the short-term WTI sellers. In a case where the bears refrain from stepping back past-$40.00, the 100-day EMA level of $39.70 regains market attention.
Additionally, 38.2% Fibonacci retracement and the week bottom surrounding $39.25 and September 09 high close to $38.70 will challenge the black gold’s further downside below $39.70.
During the commodity’s upside, the 61.8% Fibonacci retracement level of $41.00 can please the buyers before propelling them towards a horizontal area around $41.75/70 that comprises highs marked in September and the early October.
It should be noted that the August 21 low near $41.50 offers an extra filter to the WTI’s recovery moves past-$41.00.
WTI daily chart
Trend: Sideways
