- WTI remains depressed below $38.00, defies late Friday’s corrective recovery.
- Sustained trading below key Fibonacci retracement, amid normal RSI conditions, favors oil sellers.
- 21-day SMA offers an extra filter to the north, $36.75 adds to the support.
WTI declines to $37.50 during the early Asian session on Monday. The energy benchmark remains pressured despite the recent U-turns from the key SMA.
The reason could be traced from the black gold’s sustained trading below 61.8% and 50% Fibonacci retracement of the commodity’s October-November downside amid a lack of overbought/oversold RSI.
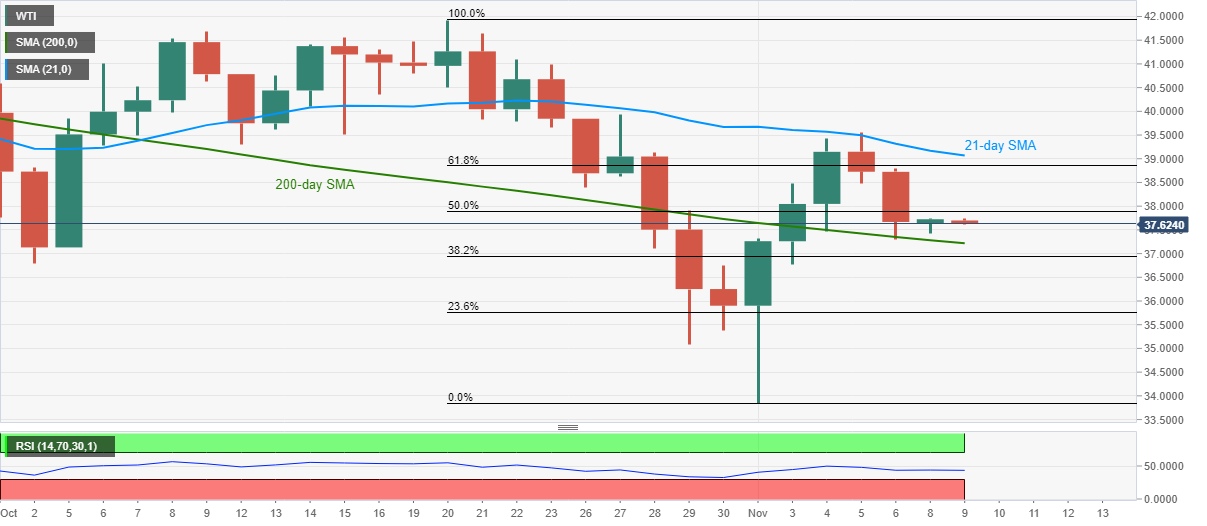
Hence, sellers again aim for the 200-day SMA level, currently around $37.20, whereas October 30 top and November 03 low highlight $36.75 as another important support for the oil bears.
If at all WTI drops below $36.75, the $35.00 round-figure may offer an intermediate halt during the south-run to the monthly low near $33.85.
Alternatively, 50% and 61.8% Fibonacci retracement levels, respectively near $37.90 and $38.85, can challenge the short-term oil buyers ahead of 21-day SMA surrounding $39.05.
Also acting as an upward barrier for the WTI bulls is the $40.00 psychological magnet.
WTI daily chart
Trend: Bearish
