- WTI reverses Tuesday’s losses, looks to extend the recovery.
- Daily chart spots a likely bull flag amid bullish RSI.
- Focus on Wednesday’s close price, EIA and US data.
WTI (futures on NYMEX) battles the $53 mark, reversing most of Tuesday’s losses, as the bulls await the Energy Information Administration (EIA) US crude stockpiles data for fresh directives.
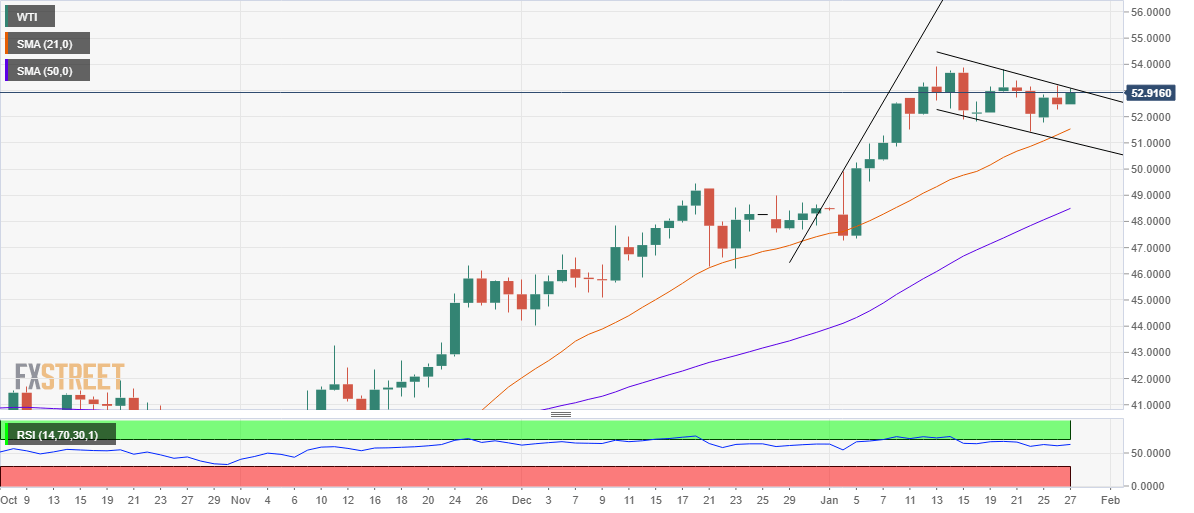
From a near-term technical perspective, the black gold remains in a consolidation phase after recoding multi-month highs at $53.93 on January 13.
The rally in the first week of this month that followed the consolidation charted a bull flag on the daily chart, which could likely get confirmed on a daily closing above $53.09 – the falling trendline resistance.
The bullish breakout would open doors towards the multi-month tops, above which the $55 threshold would be in sight.
The 14-day Relative Strength Index (RSI), currently trades at 63.12, pointing to more gains.
Alternatively, the pattern will get invalidated if the price closes the day below $51.03, the falling trendline support.
Ahead of that level, the 21-daily moving average (DMA) at $51.52 would challenge the bears’ commitment.
WTI daily chart
WTI additional levels
