- WTI bounces off $39.90 as support line of a three-day-old ascending channel plays its role.
- Bearish MACD could lure the sellers if oil prices stay below $40.00.
- 61.8% Fibonacci retracement offers near-term key support, February low is on the bulls’ radar.
WTI recovers to $40.22, up 0.50% on a day, while heading into the European session on Wednesday. In doing so, the energy benchmark defies the previous day’s pullback from the highest since March 06. On a four-hour chart, the black gold’s recovery moves could be cited by a bounce off short-term rising channel’s support line.
Given the quote’s pullback from immediate key support, its rise to June 06 high of $40.60, followed by a sustained run-up towards Tuesday’s top near $41.65, becomes widely anticipated.
However, the resistance line of a three-day-old rising channel, at $41.85, will be the key to watch afterward. Should there be a clear rise past-$41.85, February 28 bottom surrounding $44.00 might reappear on the chart.
Alternatively, a clear break below $40.00 could gain favor from the bearish MACD to diver bears towards June 12 high close to 37.20. Though, 61.8% Fibonacci retracement of May 22 to June 23 rise, at $34.98, could please the sellers then after.
WTI four-hour chart
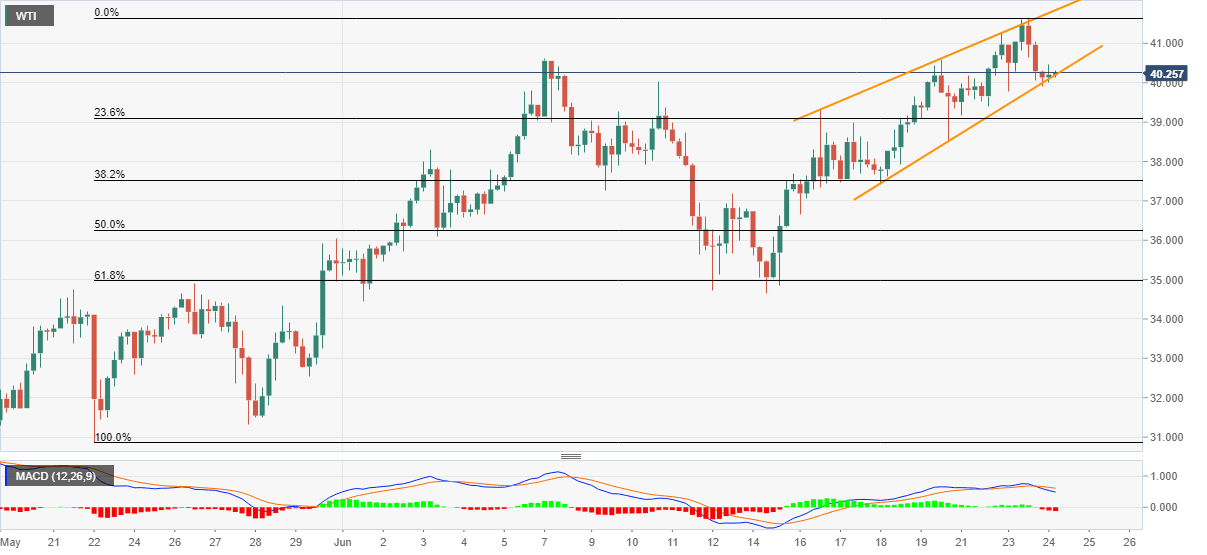
Trend: Bullish
