- WTI struggles to carry the Monday’s recovery moves near $42.15.
- Bulls will have to cross $43.00 before eyeing the monthly top.
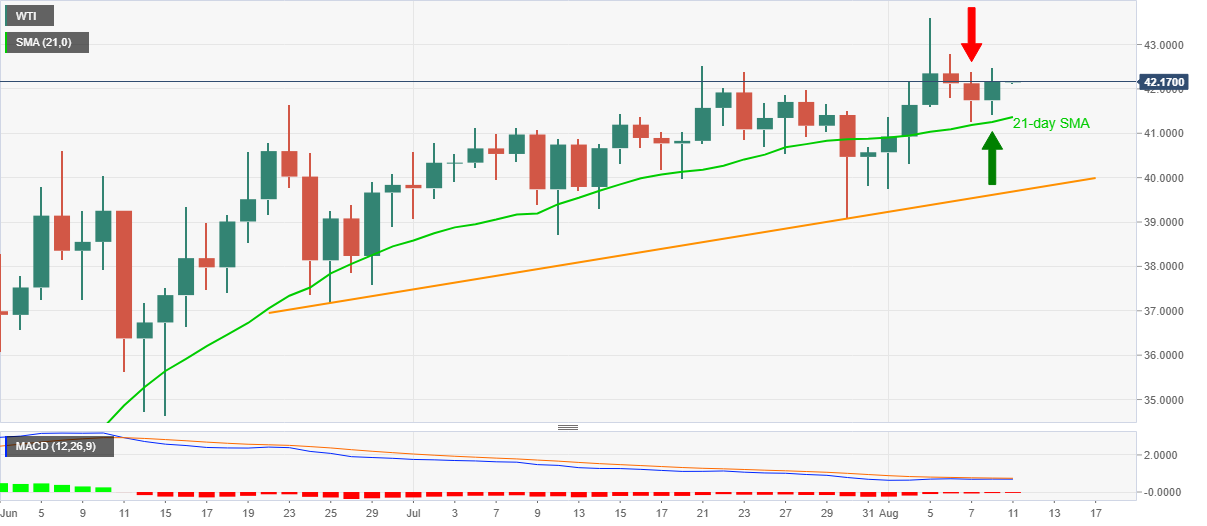
- Bearish MACD favors sellers if they manage to break 21-day SMA support.
Despite rising at the week’s start, WTI remains clueless near $42.15/20 amid the early Asian session on Tuesday. The oil benchmark flashed another spinning top, this time the bullish one, on Monday following the Friday’s bearish candlestick formation. The move suggests traders’ indecision.
Other than the candlestick formation, the black gold’s trading beyond 21-day SMA and bearish MACD also confuse the energy players.
As a result, market players will wait for a clear break of either $43.00 or the 21-day SMA level near $41.35 before entering any fresh positions.
While an upside more is more likely considering the pair’s recovery since mid-June, multiple resistances starting with the monthly high of $43.62 challenge the bulls. In doing so, February month low near $44.00 and March month top near $48.75 will be the key.
On the contrary, $40.00 and an ascending trend line from June 25, at $39.68 now, can entertain the seller below the $40.80 immediate support.
WTI daily chart
Trend: Sideways
