- WTI recovers from the short-term falling trend line.
- 50% Fibonacci retracement, the four-week-old falling trend line on bulls’ radars.
- Sellers can aim for $20 following the sustained break of the support line.
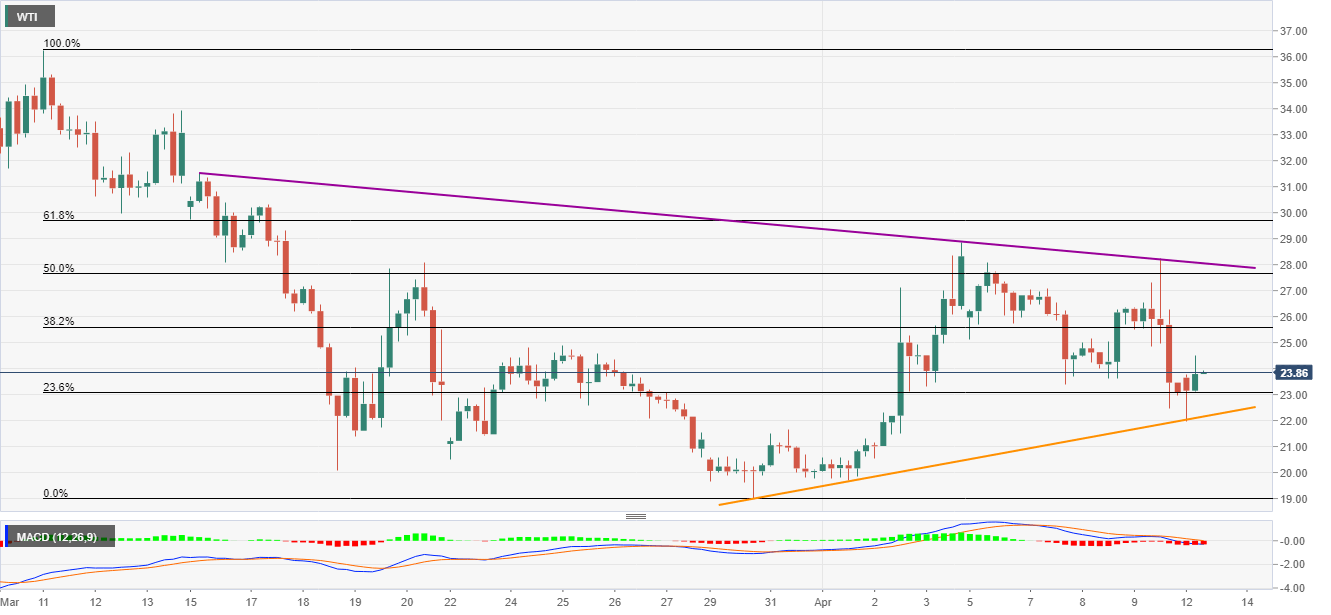
While bouncing off the monthly support line, WTI marks 3.2% gains to $23.85 ahead of the European open on Monday.
That said, the energy benchmark eyes 38.2% and 50% Fibonacci retracements of March month downside, respectively around $25.60 and $27.65.
However, the black gold’s further upside might find it difficult to cross a downward sloping trend line from March 16, currently at $28.05, amid the bearish MACD.
Alternatively, 23.6% Fibonacci retracement level near $23.00 can act as immediate support ahead of the aforementioned trend line, close to $22.15 now.
If at all the oil prices dip below $22.15, $20.00 can validate further declines below the previous month’s low of $19.00.
WTI four-hour chart
Trend: Further recovery expected
