- WTI nears the weekly top after breaking the short-term resistance line, now support.
- A sustained run-up could aim to fill the March month’s gap.
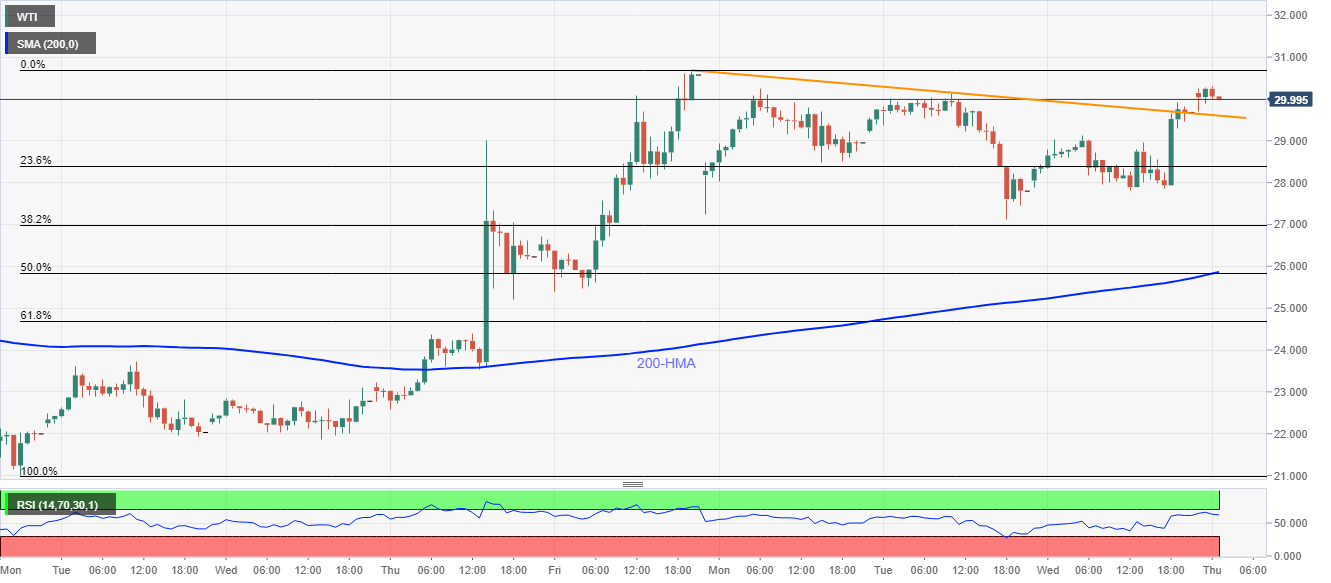
- 50% Fibonacci retracement, 200-HMA restrict near-term declines.
Having breached a three-day-old falling trend line, WTI remains positive around $30.00 amid the Asian session on Thursday.
The black gold now aims for Friday top surrounding $30.70 amid the further rise to March 11 high around $36.65.
It should, however, be noted that the energy benchmark’s rise past-$36.65 will targeting filling the previous month’s gap below $41.20.
Meanwhile, a downside break of the support-turned-resistance line of $29.360 can fetch the quote towards $27.00.
However, a confluence of 200-HMA and 50% Fibonacci retracement of March 30 to April 03 upside, near $25.80/85, will be the tough nut to crack for sellers below $27.00.
WTI hourly chart
Trend: Further recovery expected
