- WTI extends the bounces off multi-month low to near-term key upside barrier.
- February high will be important resistance.
- The bears will wait for fresh lows before taking entry.
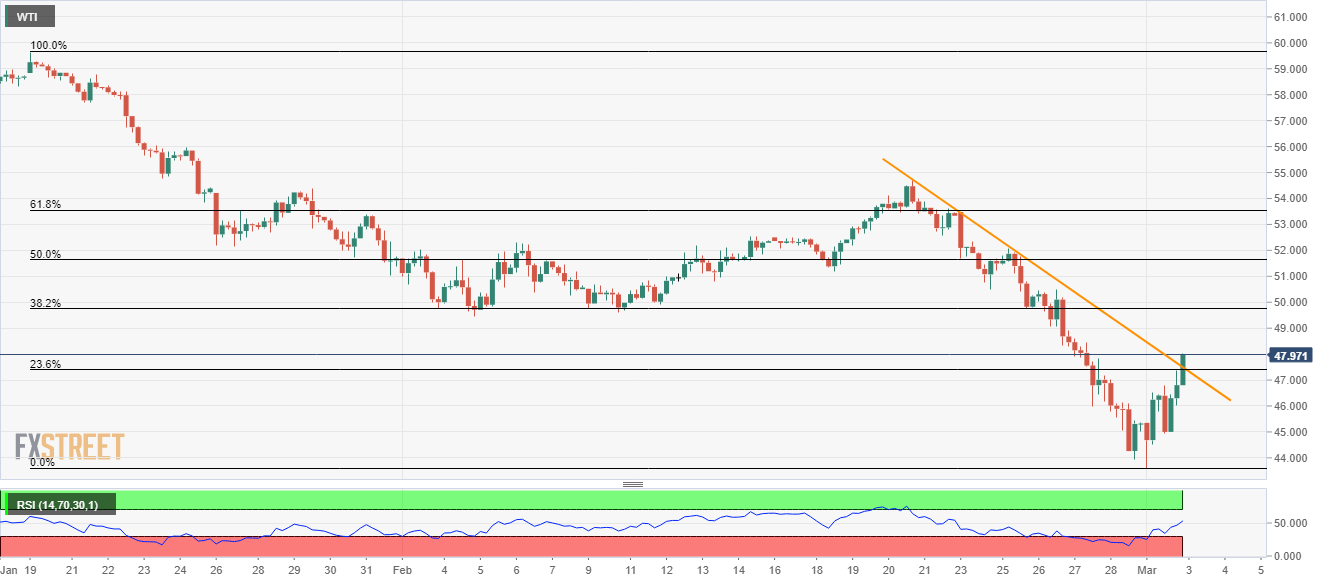
While carrying its recovery from the multi-month lows, flashed Friday, WTI takes the bids to $47.60 during the early Asian session on Tuesday. In doing so, the black gold breaks a short-term falling trend line stretched since February 20, 2020, to take aim at 38.2% Fibonacci retracement of its January-February declines.
During the energy benchmark’s sustained break of the aforementioned resistance line, backed by successful trading beyond 38.2% Fibonacci retracement level of $49.75, 50% and 61.8% Fibonacci retracement levels surrounding $51.65 and $53.55 will gain the buyers’ attention.
However, any upside beyond the February month top close to $54.70 will not refrain to challenge the late-January tops near $56.00.
Alternatively, $46.50 and the recent low near $43.60 could keep the oil’s near-term declines limited.
In a case where the black gold slips below $43.60, December 2018 low near $42.15 will be on their radars.
WTI four-hour chart
Trend: Pullback expected
