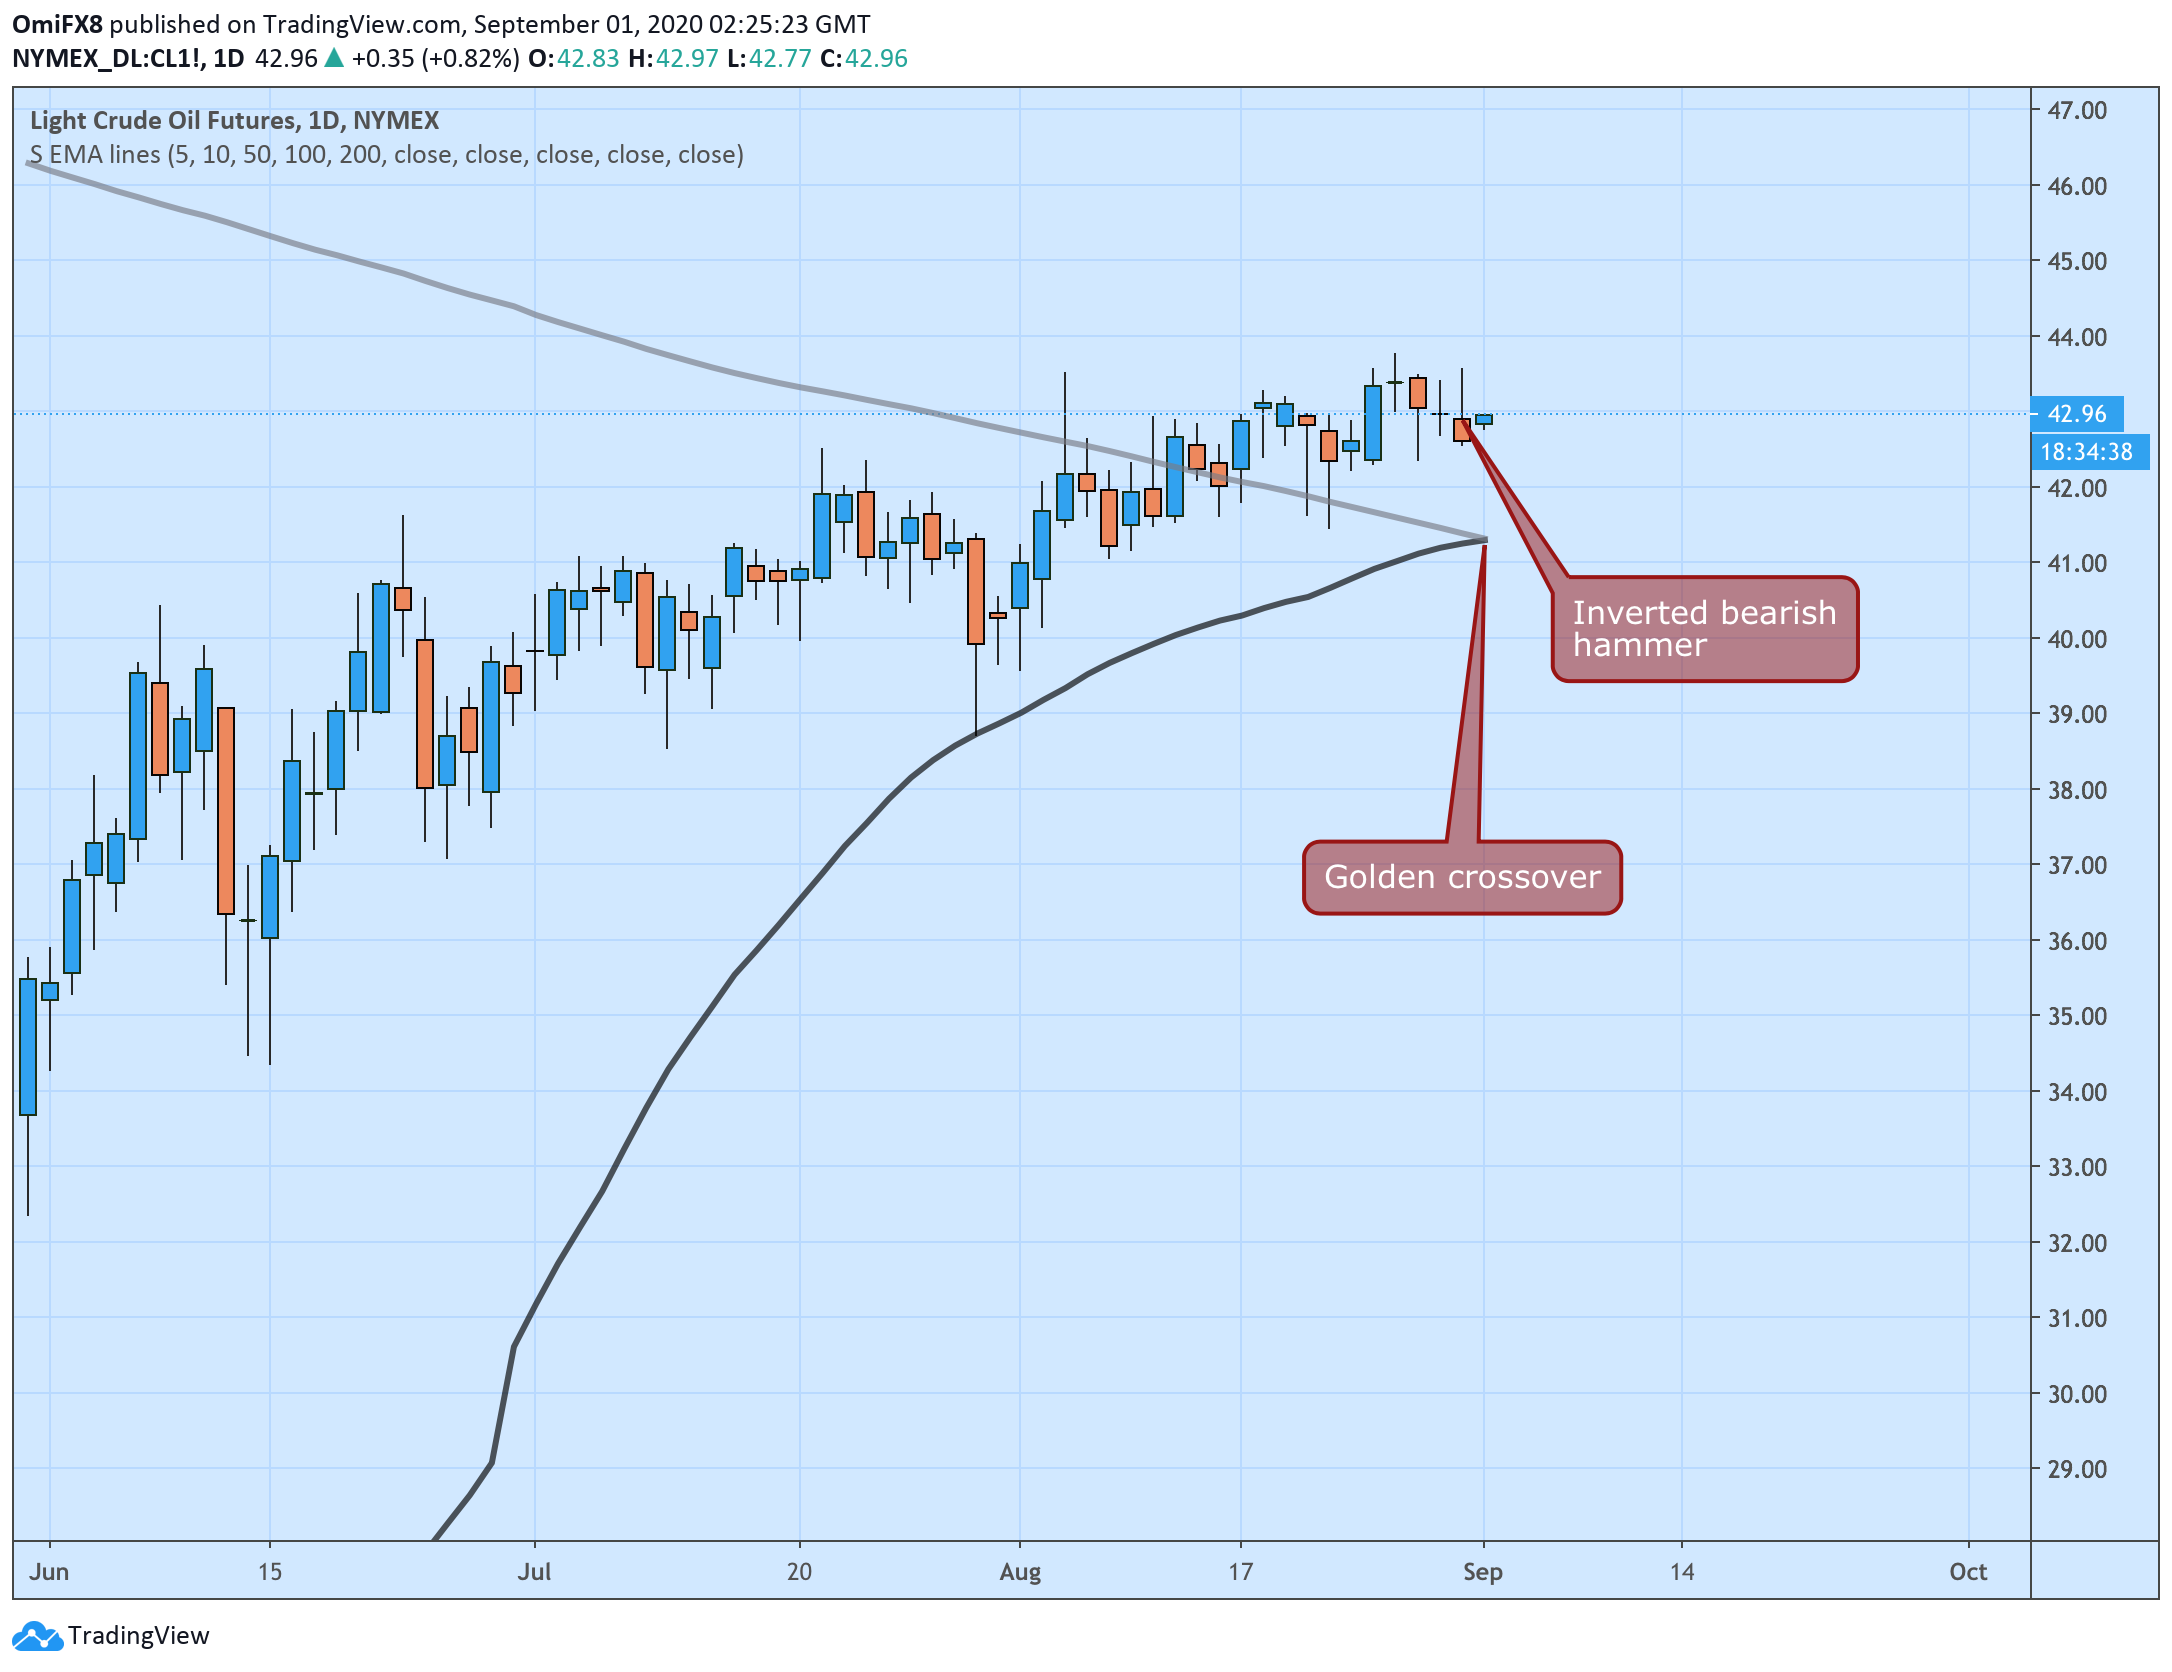
- WTI trades at $42.95 at press time versus $42.56 seen on Monday.
- Oil’s daily chart shows a golden crossover, a contrary indicator.
- Monday’s bearish inverted hammer suggests scope for price pullbacks.
West Texas Intermediate (WTI) crude, the North American oil benchmark, could soon witness a notable price drop, as a lagging indicator is about to turn bullish for the first time since December 2019.
The 50-day simple moving average of prices has almost crossed above the 200-day SMA. The resulting golden cross, a long-term bull market indicator, would be the first in nine months.
The indicator, however, is based on backward-looking moving averages and tends to lag prices and often traps buyers on the wrong side of the market. In other words, the golden cross, and long-term SMA crossovers in general, work best as contrary indicators, marking interim tops and bottoms.
Also, supporting the case for a decline in oil prices is Monday’s bearish inverted hammer candle.
Crucial support is seen at $41.33 – the confluence of the 50- and 200-day SMAs – followed by $40.00 (psychological level). Meanwhile, resistance is located at $43.78 (Aug. 26 high).
Daily chart
Trend: Bearish
Technical levels
