- WTI pauses five-day losing streak, jumps over 1.50%.
- The US oil bounces-off 100-DMA support once again.
- Markets take profits ahead of the API stocks data.
WTI (futures on Nymex) rallied more than $1 to daily highs of $37.91 in the European session, having dived out of the overnight bearish consolidation phase.
The black gold refreshed three-month lows at $36.43 in the US last session, as the sell-off in the US stocks exacerbated the pain in the higher-yielding commodity.
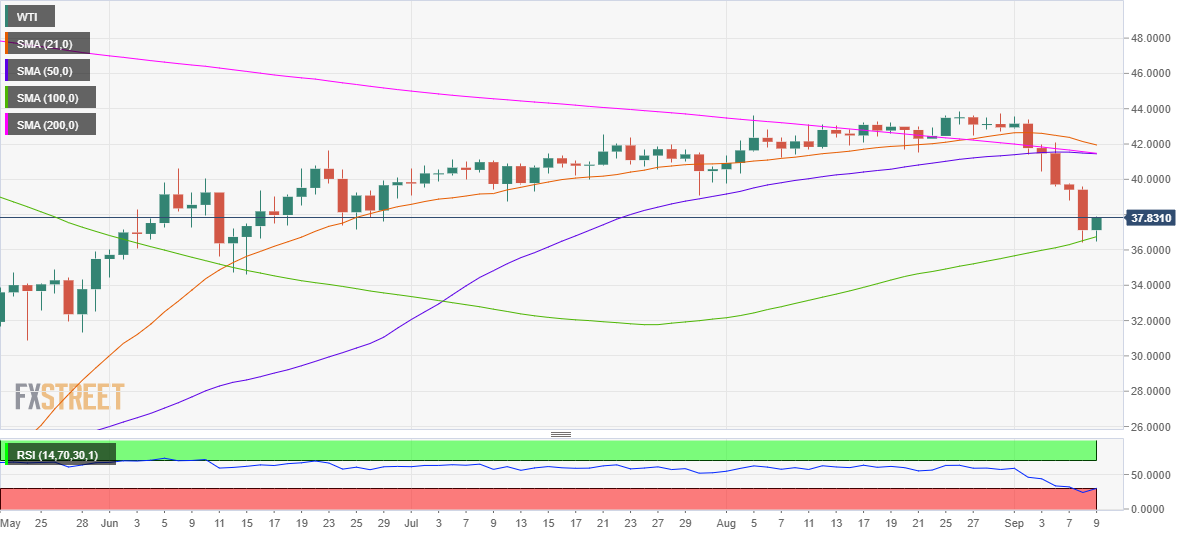
Looking at the daily chart, the price has found solid support at the 100-day Simple Moving Average (100-DMA), now at $36.75, which it has bounced-off for the second straight day on Wednesday.
Therefore, the bulls are looking to extend the recovery towards $39.80, this week’s high.
Acceptance above the latter could trigger a fresh rally towards the critical barrier aligned at $41.45, which is the convergence of the 200 and 50-DMAs.
Note that the averages are on the verge of forming a death cross pattern. Thus, the recovery could be seen as another opportunity to take profits on the long trades should the formation get validated in the coming days.
A daily closing below the robust 100-DMA support could accelerate the bearish momentum, opening floors for a test of the June low at $34.45.
To conclude, the path of least resistance appears to the downside and therefore, sell the bounce strategy could be adopted while trading the WTI barrel in the week ahead.
WTI: Daily chart
WTI: Additional levels
