- WTI prints mild losses from the highest losses since March 06.
- A broad rising wedge formation below 200-day SMA keeps the sellers hopeful.
- 61.8% Fibonacci retracement and 200-day SMA add to the upside barriers.
WTI eases from the intraday top to $40.40, down 0.52% on the day, during Tuesday’s Asian session. The energy benchmark earlier rose to over the three-month top of $41.25. Though, the following pullback keeps it’s between the bearish chart pattern.
Other than the downside favoring formation, MACD conditions are also in favor of the sellers. However, a daily closing below an ascending trend line from April 21, at $38.60 now, becomes necessary for the bears to enter any trade.
In doing so, a $ 40.00 round-figure and 100-day SMA level of $34.05 might offer additional rest-points during the black gold’s heavy fall below $10.00 theoretical target.
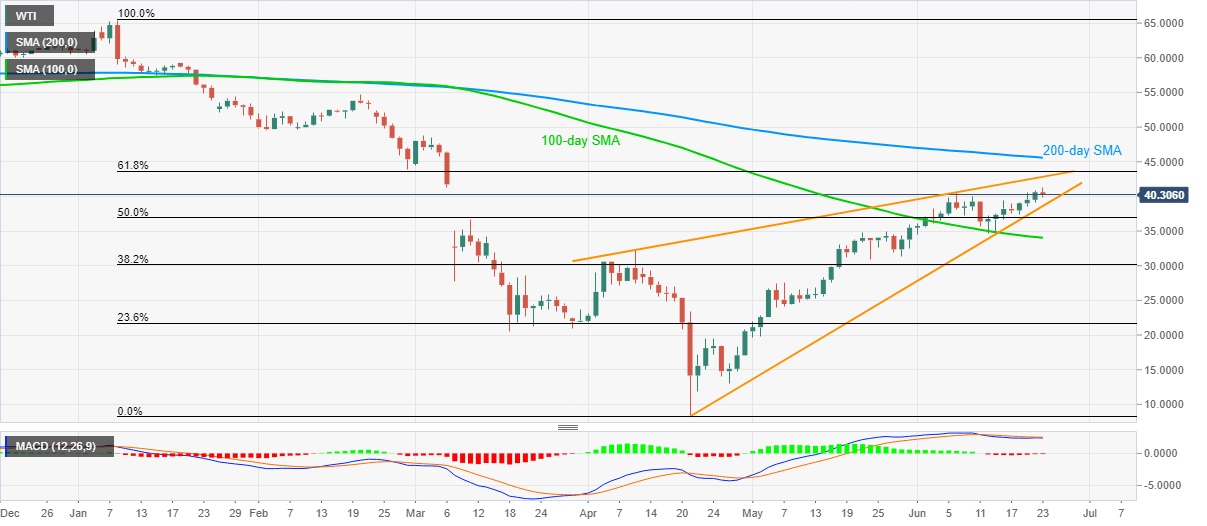
On the upside, a clear break beyond the rising trend line from April 09, at $42.85 now, will be challenged by 61.8% Fibonacci retracement of January-April fall near $43.70. Additionally, 200-day SMA, at $45.60 now, offers an extra upside barrier during the energy benchmark’s further rise.
WTI daily chart
Trend: Pullback expected
