- WTI bulls flirt with March 2020 high amid overbought RSI conditions.
- Bearish chart pattern, multiple upside hurdles question further advances.
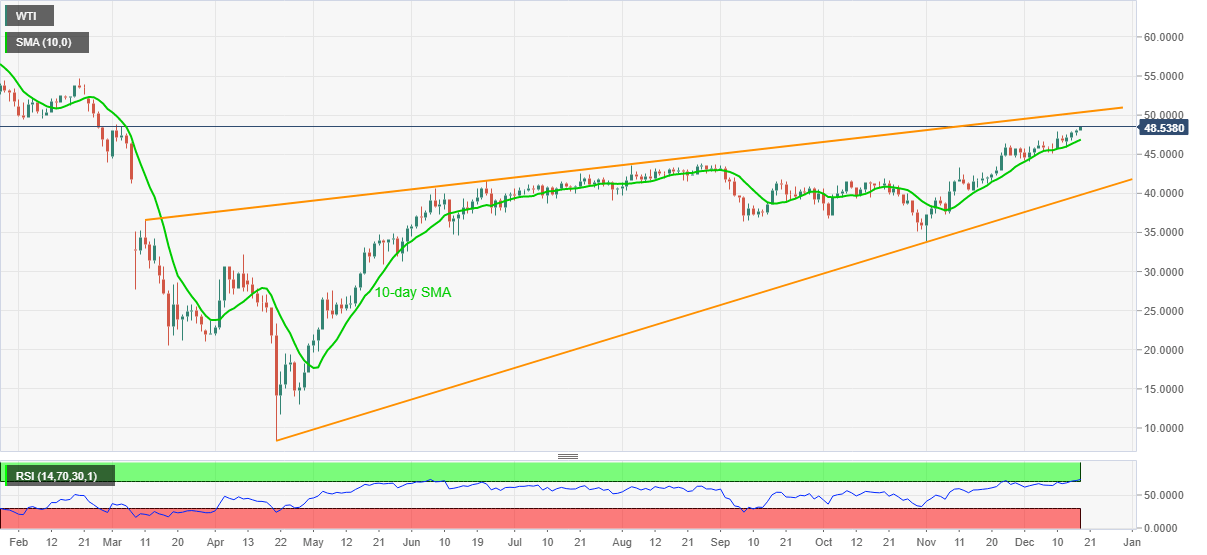
- 10-day SMA guards immediate downside, $39.80 becomes the key support.
WTI prints a four-day winning streak as buyers attack the March 2018 high. The energy benchmark recently refreshed the multi-day peak to $48.58, currently up 1.1% near $48.55, during early Thursday.
Even so, multiple resistances to the north, coupled with the overbought RSI conditions on the daily (D1) chart, suggest the black gold’s pullback.
As a result, 10-day SMA, at $46.87, is closely watched as nearby support before directing the oil sellers towards the $45.00 and the monthly bottom near $44.20. However, November’s top near $43.30 and multiple upticks marked in September and October around $42.00 can restrict the quote’s further downside.
In a case where the WTI bears keep reins below $42.00, $40.00 psychological magnet and the support line of a nine-month-old bearish formation, rising wedge, around $39.80, will be the key to watch.
Alternatively, March high precede February lows, respectively around $48.75 and $49.45, to challenge the WTI buyers ahead of the $50.00 round-figure. Also acting as a strong resistance is the upper line of the wedge, at $50.35 now.
WTI daily chart
Trend: Pullback expected
