- WTI keeps pullback moves from the mid-June lows marked on Thursday.
- Four-month-old descending trend line offers immediate support.
- 200-day SMA challenges the corrective bounce below a falling resistance line from August 26.
WTI prints mid intraday gains while trying to keep the U-turn from the multi-day low of $35.08 flashed the previous day. In doing so, the black gold picks up bids near $36.35 ahead of Friday’s Tokyo open.
While a failure to provide a daily closing below a falling trend line from June 25 triggered the commodity’s latest U-turn, the quote remains below 200-day SMA amid the most bearish MACD signals in seven weeks.
As a result, the current recovery moves can be ignored unless breaking the 200-day SMA level of $37.73, which in turn holds the key to the energy benchmark’s run-up to the short-term resistance line, at $41.50. However, the $40.00 psychological magnet can offer an intermediate halt during the rise.
On the contrary, a downside break below the stated support line, currently around $36.00, will aim for the June 15 low of $34.65 before directing the WTI bears to the June month’s bottom surrounding $34.45.
Should WTI remains offered below $34.45, May 22 low near $30.85 and the $30.00 round-figure will be important to watch.
WTI daily chart
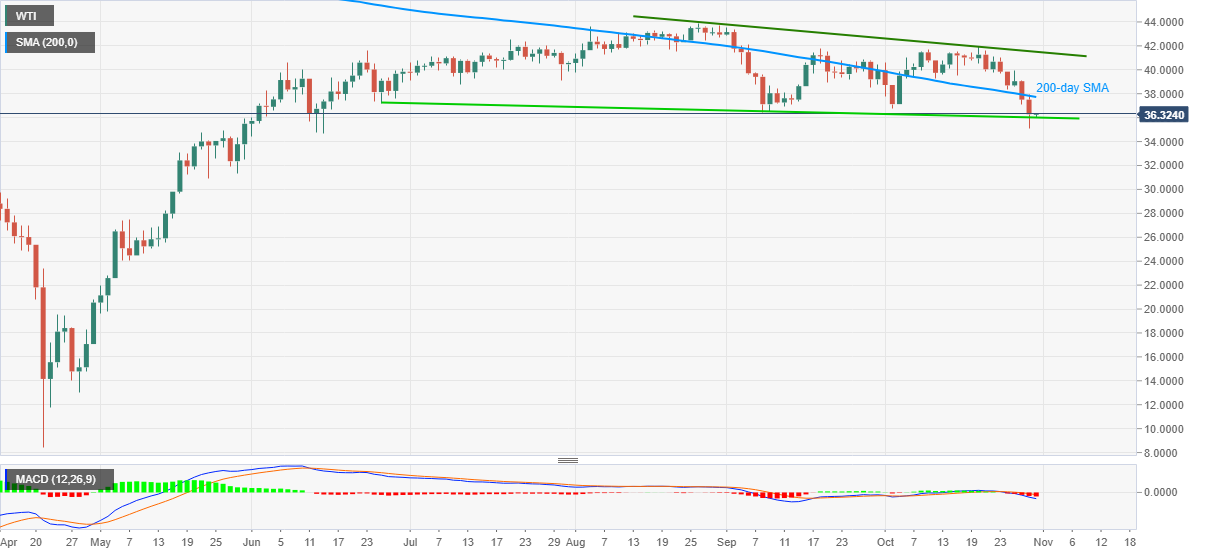
Trend: Bearish
