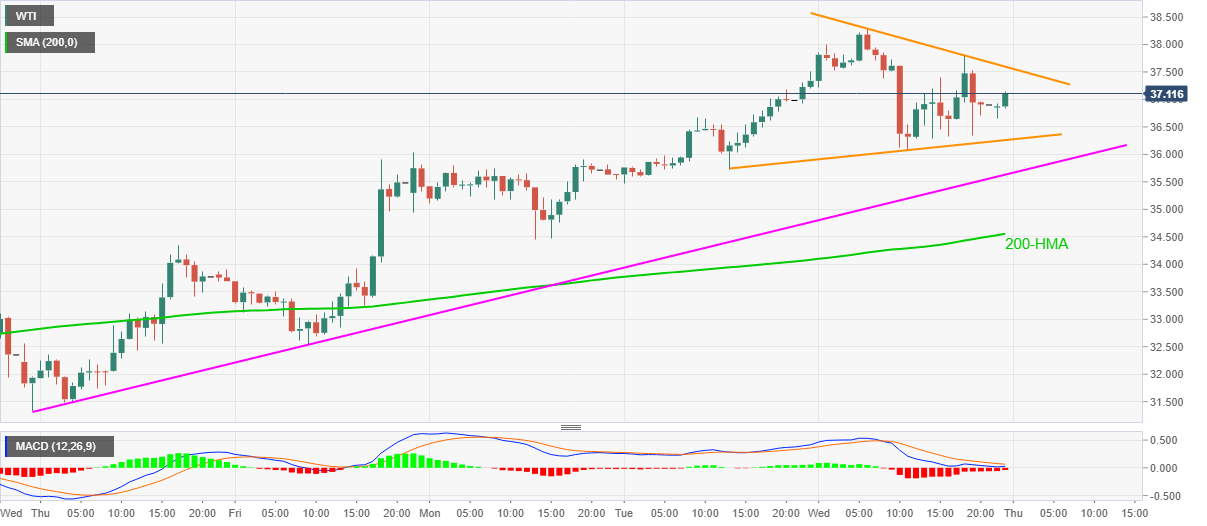
- WTI seesaws near three-month high inside a two-day-old symmetrical triangle.
- A one-week-old ascending trend line, 200-HMA adds to the support.
- An upside clearance will accelerate the moves to fill the early-March gap above $41.00.
WTI takes rounds to $37.08 while portraying a short-term symmetrical triangle formation during the early Asian session on Thursday. The black gold rose to the highest since March 11 the previous day but MACD’s weakness dragged it back from $38.30.
The oil benchmark currently rises towards the triangle’s resistance line, at $37.60, a break of which could again push it towards $38.30.
However, a sustained run-up past-$38.30 will enable the bulls to fill the gap below March 06 low of $41.22.
Meanwhile, a downside break of the triangle’s support, at $36.25 now, can fetch the quote to an ascending trend line from May 27, currently around $35.60.
In a case where the oil benchmark keeps the downside below $35.60, 200-HMA level of $34.55, will be the key to watch.
WTI hourly chart
Trend: Bullish
