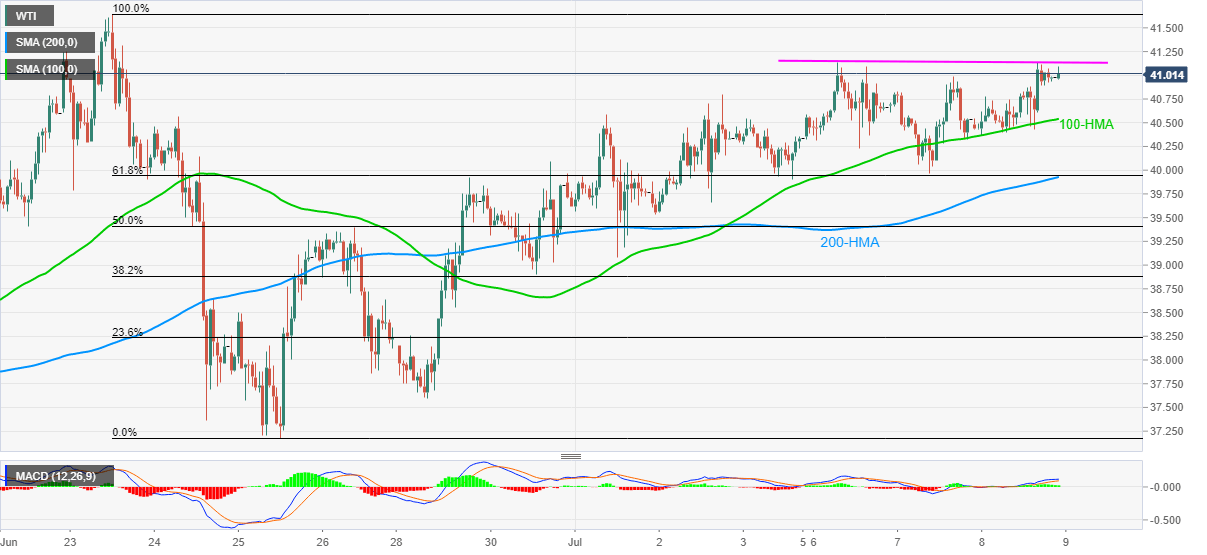
- WTI stays mildly bid above $41.00 while remaining above 100-HMA.
- Multiple failures to cross $41.15 confront a bullish chart formation on a short timeframe.
- June month’s top, February low will be on the buyers’ radar after a successful break.
- Bears are likely to seek entries below $39.90.
WTI seesaws around $41.00 during the pre-Tokyo open on Thursday. Considering the oil benchmark’s repeated failure to overcome $41.15 during the week, coupled with Tuesday’s bounce off $39.96, the rounding bottom bullish chart pattern is clearing coming up on the hourly play. Other than the upside suggesting formation, bullish MACD and the sustained trading beyond 100-HMA also favor the optimists.
Though, a clear break of $41.15 becomes necessary for the bulls to attack June month’s top near $41.65. In a case where the black gold remains positive after crossing the previous month’s high, February’s low around $44.00 will be on their radars.
It’s worth mentioning that December 2018 low near $42.45 can act as an intermediate halt during the rise.
Meanwhile, a confluence of 200-HMA and 23.6% Fibonacci retracement of June 23-25 fall, around $39.90, becomes near-term strong support to watch during the quote’s fresh weakness below 100-HMA immediate rest-point of $40.54.
Should the oil prices decline below $39.90, 50% Fibonacci retracement around $39.40 holds the gate for the quote’s additional downside towards the sub-$38.00 region.
WTI hourly chart
Trend: Bullish
