- WTI extends latest pullback from $33.90 to stay near 11-week top flashed the previous day.
- Buyers await a clear upside break of the triangle to challenge March top.
- 200-bar SMA adds to the support below $34.00.
While flashing yet another move inside a short-term symmetrical triangle, WTI drops to $34.07, down 0.60% on a day, during Wednesday’s Asian session.
However, the black gold nears the breakout of the immediate triangle formation, which in turn highlights $34.30 resistance and $34.00 support as the key.
Considering the normal RSI conditions, the oil benchmark is mostly expected to provide an upside break of $34.30 that can challenge Tuesday’s top of $34.91.
Though, buyers will wait for a sustained move beyond $35.00 round-figure before aiming for March month top around $36.65.
On the downside, a 200-bar SMA level of $33.65 can question bears prior to offering $33.00 to them.
WTI 30-minutes chart
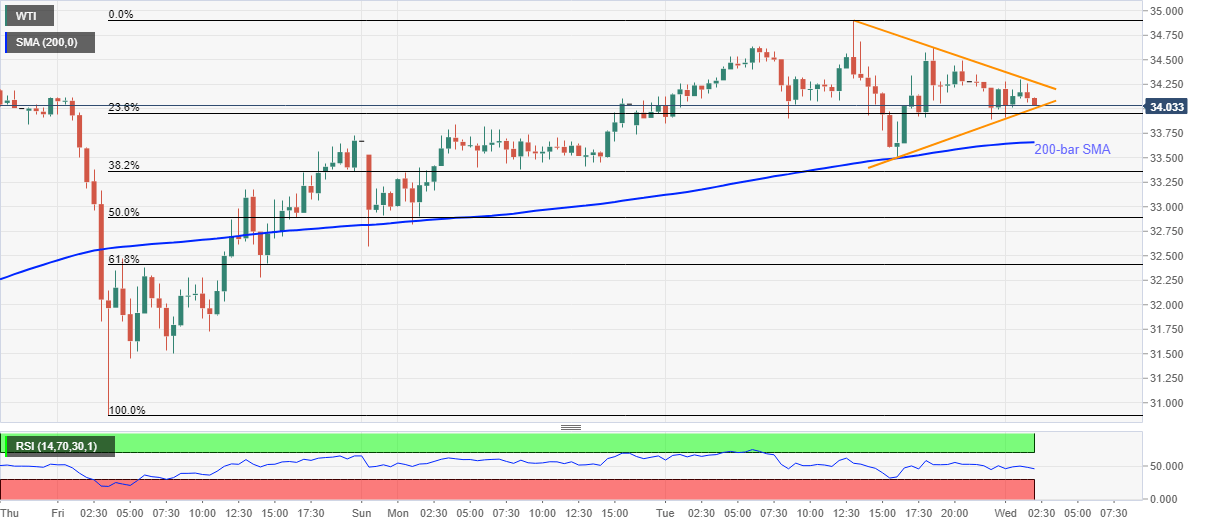
Trend: Bullish
