- WTI recovers from two-week low following oversold RSI.
- The key upside barriers stand tall to check buyers.
- The bears await fresh monthly low before entering a new trade.
WTI rises 1.04% while taking the bids to $50.35 amid the initial trading hours on Wednesday. The black gold recently benefited from oversold RSI conditions but is yet to cross the key resistances.
Among them, a downward sloping trend line from February 20, at $51.30, acts as the immediate challenge to the buyers.
Should there be a sustained recovery beyond $51.30, 200-bar SMA level of $53.73 and 61.8% Fibonacci retracement of the energy benchmark’s declines from January 19 to February 04, at $55.73, will return to the charts.
Alternatively, sellers will refrain from entering a new trade unless oil prices decline low the monthly low surrounding $49.40. In doing so, late-2018 high around $46.75 could grab the bears’ attention.
WTI four-hour charts
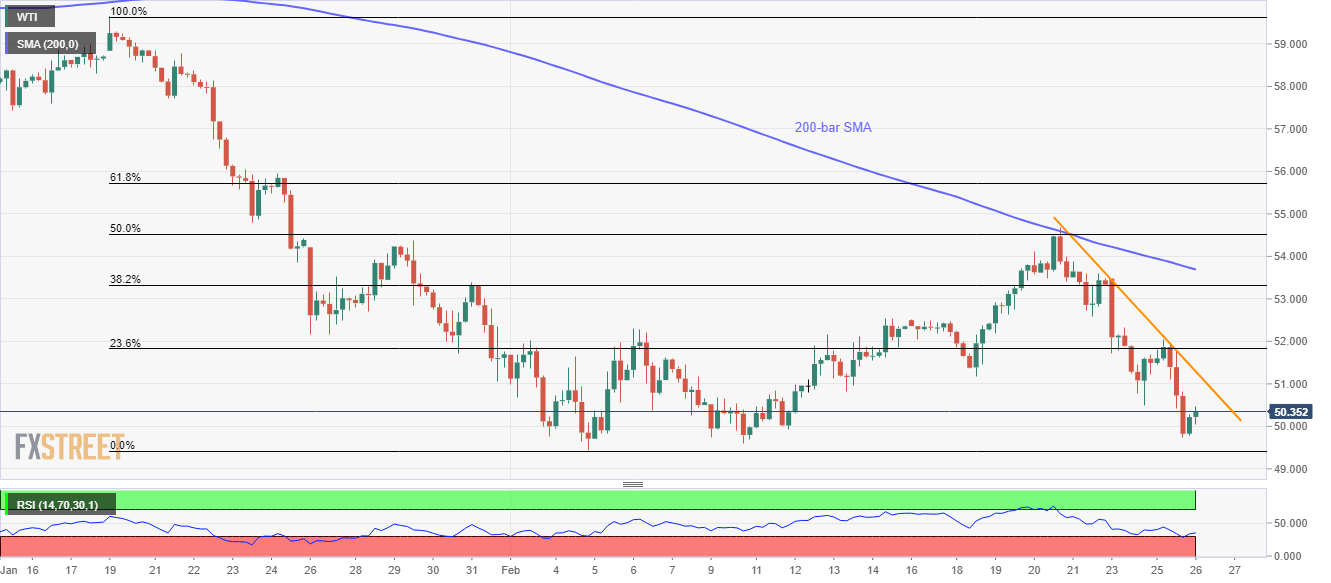
Trend: Bearish
