- WTI stays struggles to extend the run-up past-100-bar SMA inside an eight-day-old triangle.
- Normal RSI conditions, sustained trading above the key SMA keeps buyers hopeful.
- Sellers may aim for $40.60/55 on the confirmed downside.
WTI eases from intraday top of $42.69 to $42.51, still up 0.06% on a day, during Monday’s Asian session. The black gold funnels down a short-term symmetrical triangle while staying above 100-bar SMA.
With the normal RSI conditions joining the energy benchmark’s sustained trading beyond the crucial SMA, buyers are likely to regain the controls should the quote manage to clear $43.00 triangle resistance.
In doing so, the quote may initially attack the monthly top near $43.60 ahead of targeting February month’s low near $44.00.
Alternatively, a downside break of the triangle’s support, at $42.30 will have to slip beneath the 100-bar SMA level of $41.67 to aim for $41.00 and $40.60/55 rest-points.
During the further weakness below $40.55, the oil bears will attack $40.00 and the monthly low near $39.75.
WTI four-hour chart
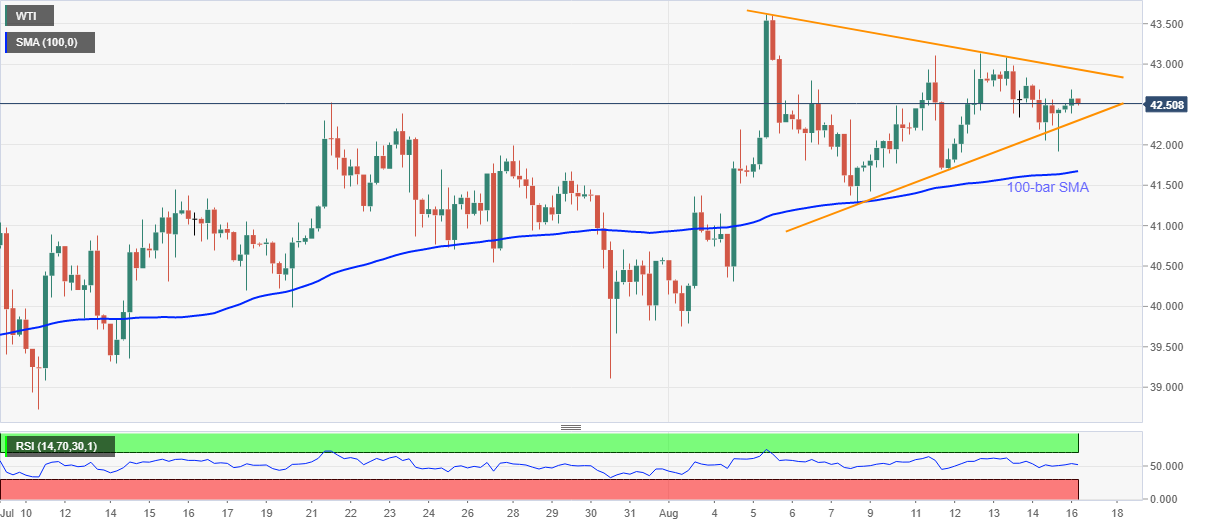
Trend: Bullish
