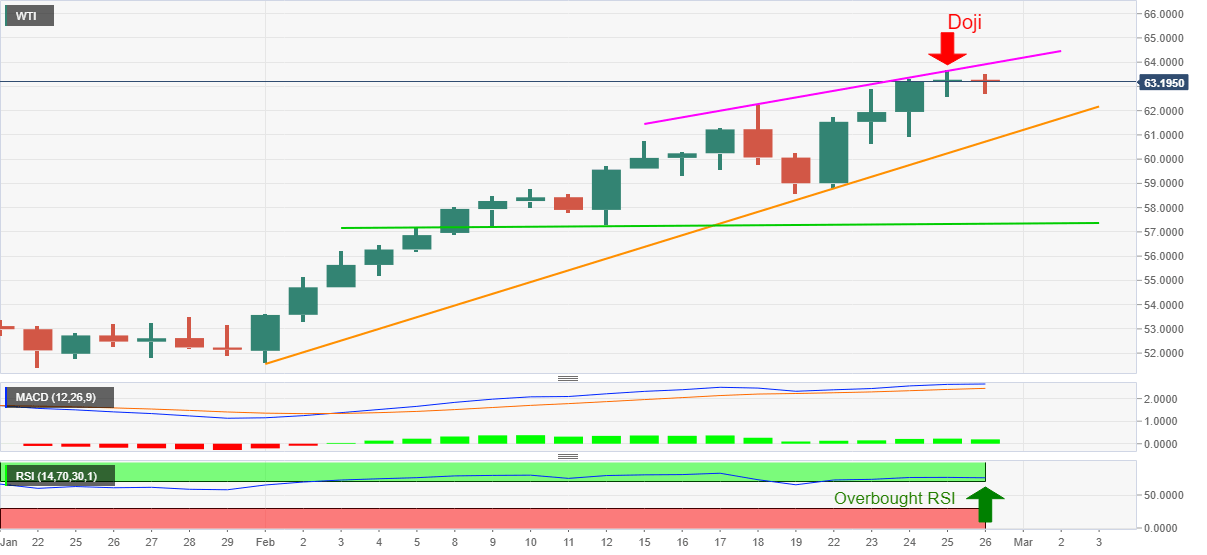
- WTI snaps four-day winning streak, trims early Asian losses off-late.
- Bearish candlestick, overbought RSI favor WTI sellers to eye monthly support line.
- One-week-old rising trend line adds to the upside filters.
WTI remains on the back foot, currently down 0.11% to $63.20, despite the latest bounce off intraday low of $62.71 during the early Friday.
The black gold refreshed a 13-month high the previous day before declining from $63.71. The following pullback, however, couldn’t last long and portrayed a Doji candlestick on the daily (1D) chart.
Not only the bearish candlestick but overbought RSI conditions also probe the energy benchmark’s uptrend.
Hence, oil sellers can keep their eyes on the monthly support line, at $60.72 now, during further declines. However, any further weakness will be probed by the three-week-old horizontal support near $57.40.
Alternatively, a daily closing beyond $63.71 will defy the bearish Doji but will need a clear break of the immediate resistance line, currently around $64.00 to recall the oil buyers.
Overall, WTI bulls seem tiring and hence notable pullbacks can’t be ruled out.
WTI daily chart
Trend: Pullback expected

