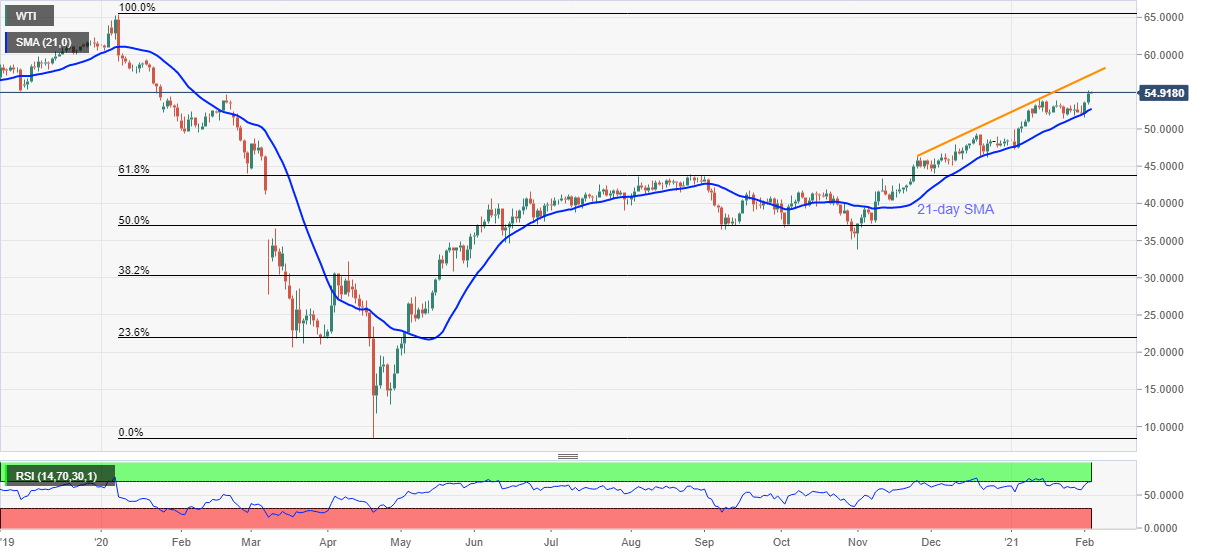
- WTI wavers around late-January 2020 high, eases from $55.00 seems to offer immediate resistance.
- Overbought RSI conditions can drag the quote back to February top but 21-day SMA will restrict further downside.
- 10-week-old resistance line lures the bulls beyond $55.00.
Despite marking repeated pullback moves from $55.00, WTI remains strong near the highest since January 24, 2020, currently up 0.35% near $54.90, during early Wednesday. In doing so, the energy benchmark keeps the previous day’s upside break of February 2020 top.
Though, overbought RSI conditions raise doubt on the quote’s further advances. As a result, intraday sellers may take a risk in case the black gold prices drop below February 2020 peak surrounding $54.70.
Following that, the January’s peak surrounding $53.90 and 21-day SMA level of $52.70 will be the key levels to watch, a break of which could change the current uptrend.
On the contrary, successful trading beyond $54.70 will keep hammering the $55.00 threshold while targeting an upward sloping trend line from late November, at $57.35 now.
Should oil bulls dominate past-$57.35, $60.00 psychological magnet and the last year’s high of $65.35 should gain the market’s attention.
WTI daily chart
Trend: Pullback expected

