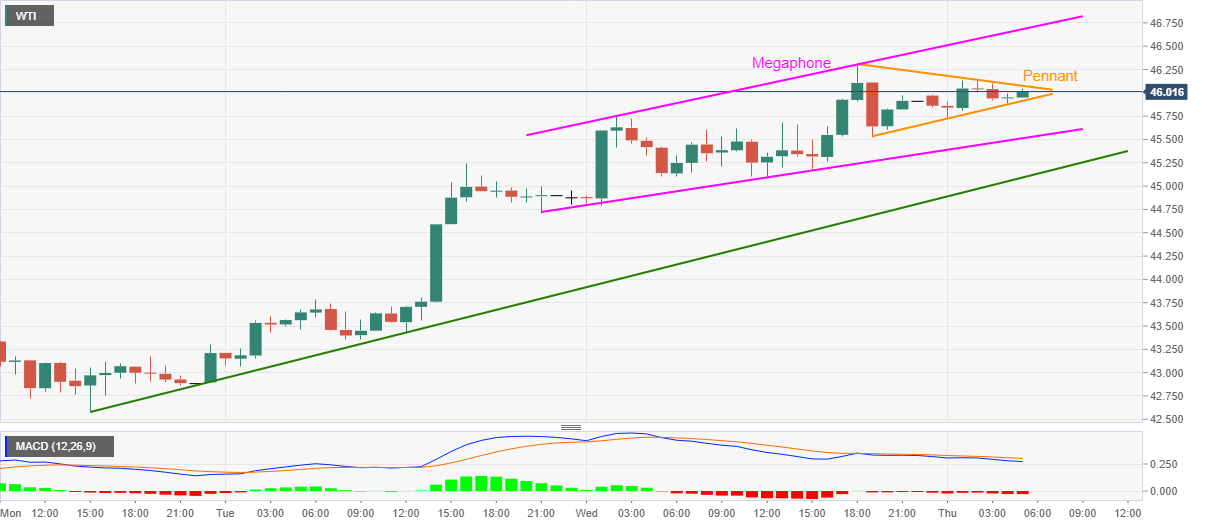
- WTI prints mild gains while staying around the early March high.
- The immediate megaphone resistance adds to the upside filters.
- Bearish MACD challenges the bulls but sellers await a break of weekly support line.
WTI crosses $46.00, up 0.45% intraday, during the pre-European session on Thursday. The energy benchmark forms a bullish pennant on the hourly (1H) chart while taking rounds to the highest level since March 05, flashed the previous day.
Although the bullish chart pattern is likely to keep the oil buyers hopeful, on the break of $46.10, the upper line of a short-term megaphone pattern, at $46.70 now, seems to challenge the quote’s further upside amid bearish MACD.
It should, however, be noted that the commodity’s rise past-$46.70 will eye the March month’s peak near $48.75.
Meanwhile, the support line of pennant and megaphone, respectively around $45.90 and $45.50, can entertain the intraday sellers. Though, a clear downside below the weekly support line, at $45.10, will be necessary to rule out the black gold’s short-term upside.
Following that, the early Tuesday’s high near $43.80 should lure the oil bears.
WTI hourly chart
Trend: Bullish

