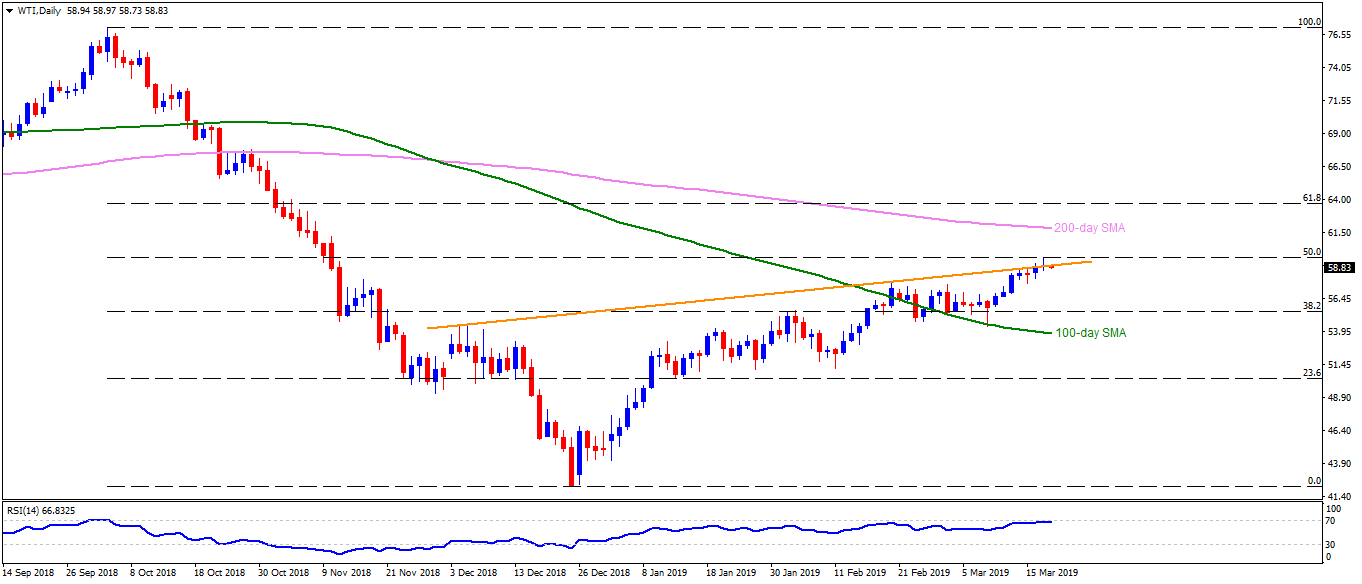
WTI daily chart
- WTI is taking the rounds near $59.00 during early Wednesday.
- The energy benchmark struggles with 15-week old ascending trend-line stretched since December 04, at $60.00, in order to justify its strength while 14-day relative strength index (RSI) being close to the overbought region.
- As a result, the quote can witness pullback to $57.80/85 resistance-turned-support including highs marked on Feb 20 and March 01 coupled with March 15 low.
- Though, price decline under $57.80 may have lesser supports than to meet 38.2% Fibonacci retracement of October – December downturn at $55.70 and $54.10 comprising 100-day simple moving average.
- On the contrary, a successful break of $60.00 enables buyers to aim for 200-day SMA level of $61.90 with $61.00 round-figure expected to offer intermediate halt.
- If bulls refrain from respecting 200-day SMA, 61.8% Fibonacci retracement near $64.00 could flash on their radar to target.
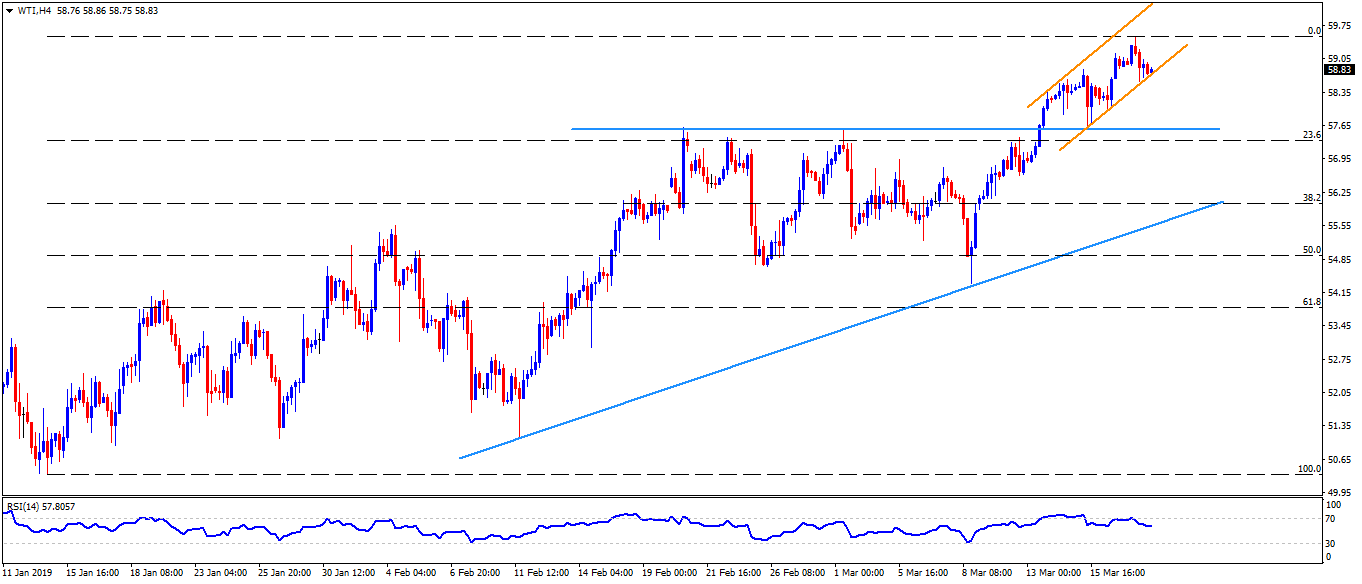
WTI 4-Hour chart
- A week-old upward sloping trend-channel support, at $58.60, can offer immediate rest during pullback with another ascending trend-line at $55.50 being expect buffer between $55.70 and $54.10.
- Also, the channel resistance-line at $60.50 may validate the upside past-$60.00.
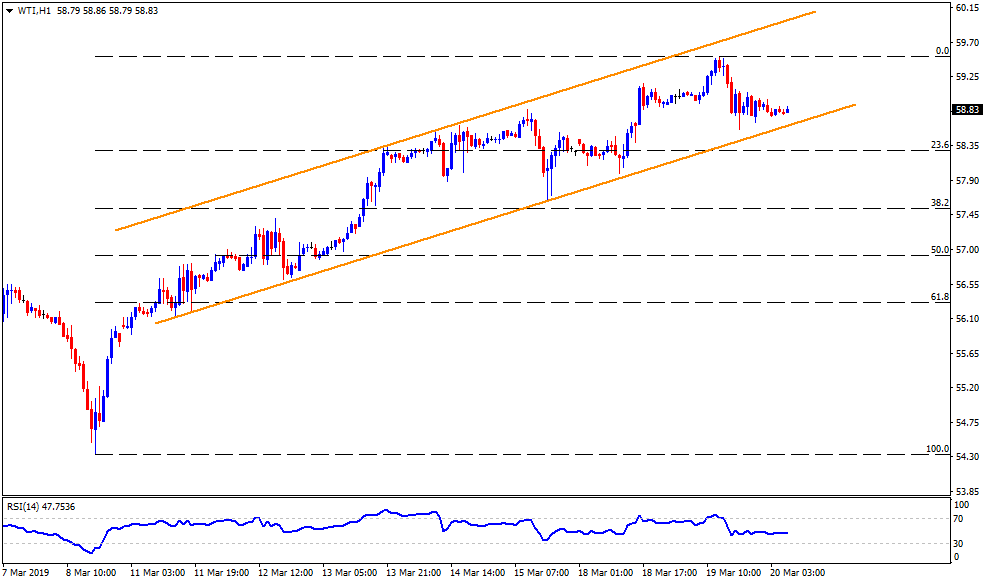
WTI hourly chart
- $59.40 could be termed as a close resistance.
- $55.20 can fine-tune the declines toward $54.10 after $55.50.