- A short-term symmetrical triangle limits the energy benchmark’s momentum.
- 4H 200/100 MA offers strong downside support inside the formation.
- Weak RSI levels indicate inaction.
WTI is just ahead of the key short-term support confluence while taking the rounds to $56.80 during early Friday.
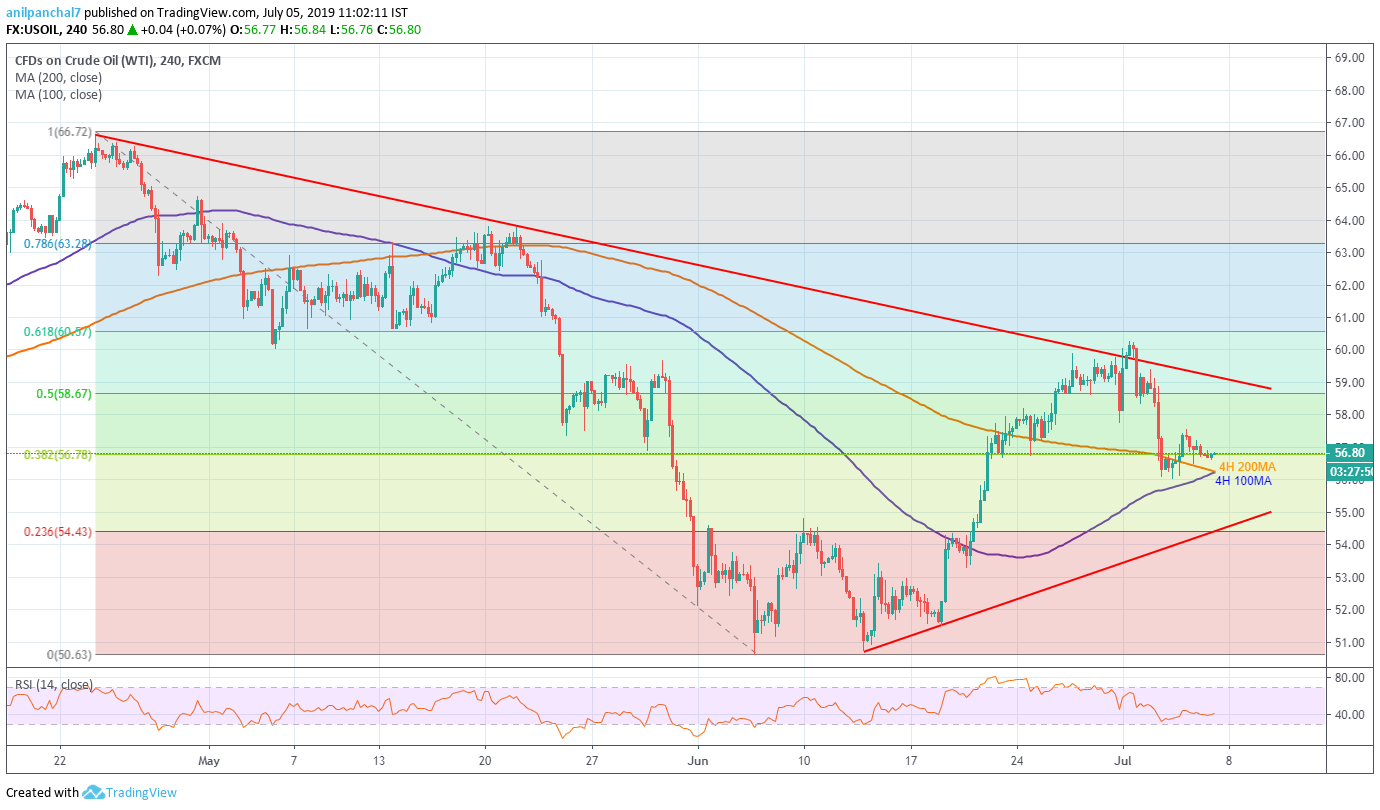
200 and 100 bar moving averages on the 4-hour chart (4H 200/100 MA) portrays the $56.20/30 confluence as the key support, a break of which highlights another crucial rest region around $54.40 comprising 3-week old ascending trend-line and April – June downpour’s 23.6% Fibonacci retracement.
During the black gold’s further declines under $54.40, June 03 low near $52.10 and $50.60 mark surrounding June 05 bottom can please sellers.
It should be noted that the 14-bar relative strength index (RSI) is near to oversold territory with modest swings indicating price inaction.
Alternatively, June 27 low near $57.80 and a descending trend-line resistance near $59.25 may question the quote’s upside momentum targeting $60.00 and May month high near $63.80.
WTI 4-hour chart
Trend: Sideways
