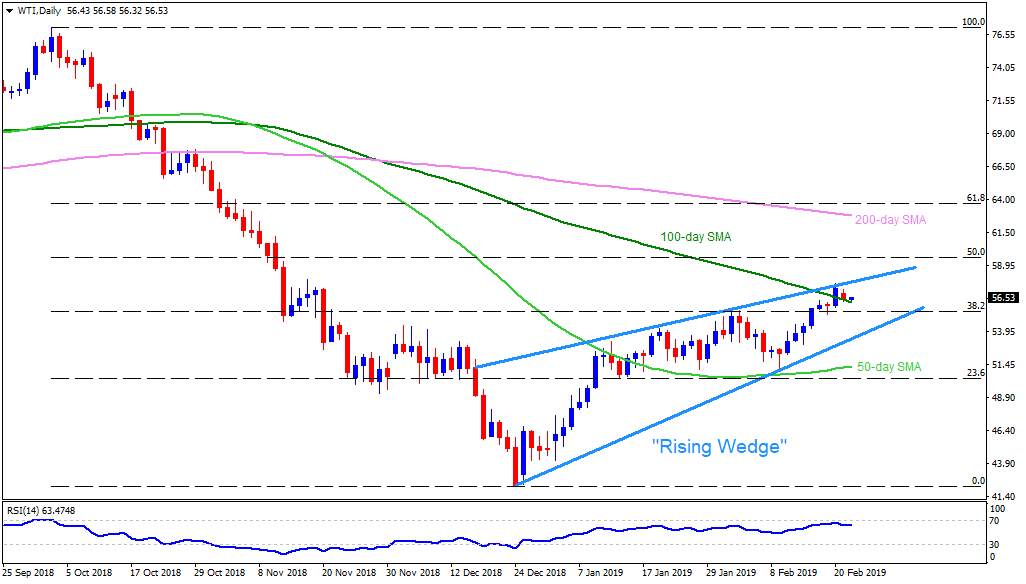
WTI daily chart
- WTI trades around $56.50 on early Friday.
- The crude benchmark portrays “rising wedge” bearish formation if connecting highs through mid-December and the lows since December 24.
- 100-day simple moving average (SMA) level of $56.20 acts as immediate support, a break of which can trigger declines to 38.2% Fibonacci retracement of its October – December downturn, at $55.45.
- During the quote’s additional downturn past-$55.45, $54.00 may offer an intermediate halt towards formation support of $53.30, which if broken can push sellers to aim for 50-day SMA level of $51.30.
- Meanwhile, pattern resistance at $57.80 could cap nearby upside ahead of highlighting $58.00 and $58.75-80 to buyers.
- Should there be additional rise past-$58.80, 50% Fibonacci retracement around $59.50, $60.00 round-figure and 200-day SMA level of $62.85 might flash on bulls’ radar.
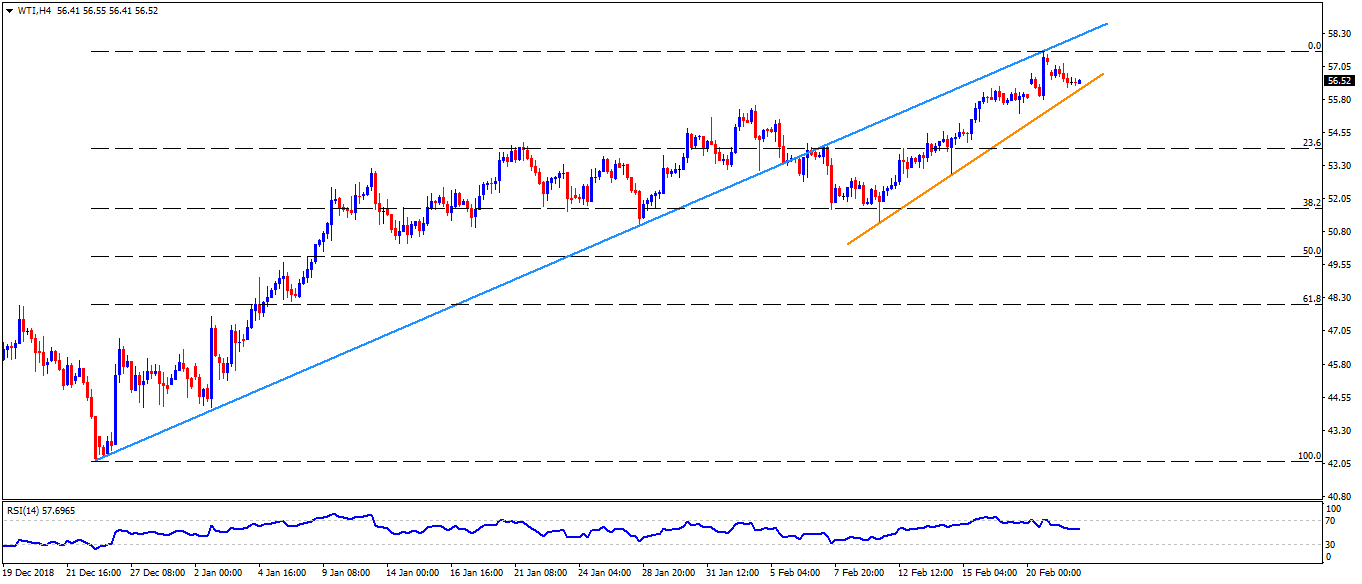
WTI 4-Hour chart
- A closer look at the chart reveals that an upward sloping trend-line stretched since early last week, at $56.30, may come forward earlier than $56.20 support discussed above. Also, $55.55 can act as buffer ahead of $55.45.
- On the upside, $57.15 could restrict adjacent rise before $57.80 whereas a support-turned-resistance, at $58.30, can stop the advances to $58.80.
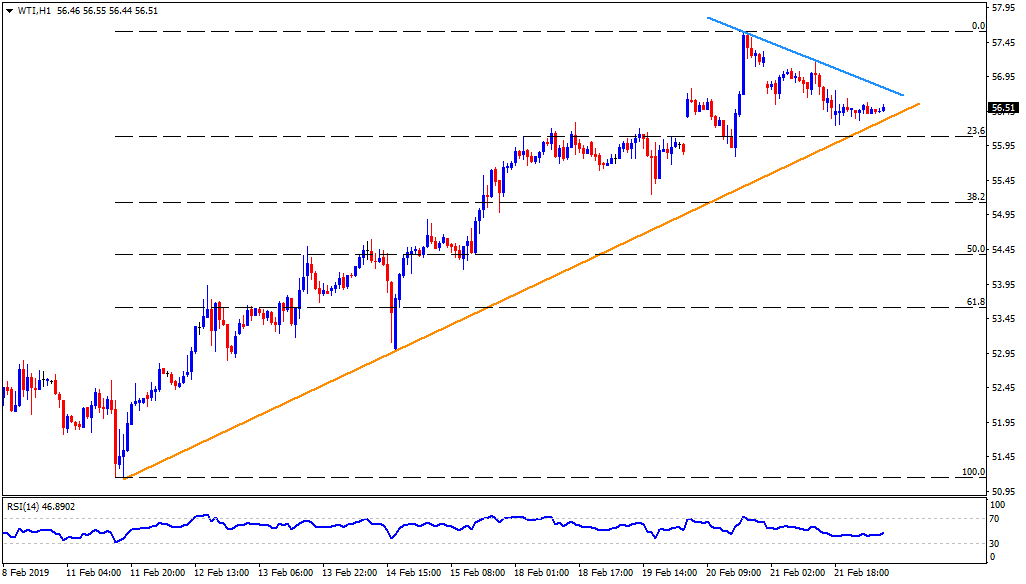
WTI hourly chart
- The nearby downward sloping resistance-line, at $56.80, can be termed as a close call for the energy benchmark that can lead towards $57.15 and $57.80 during the further rise.
- Alternatively, $56.30, $55.25 and $54.90 are some additional numbers that should be taken care of if holding short positions.