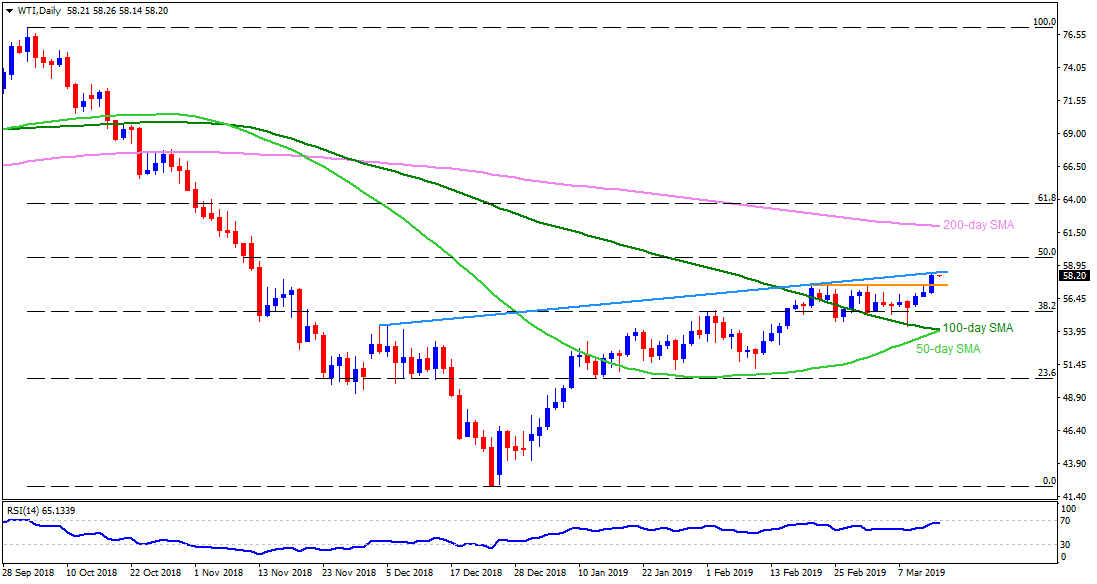
WTI daily chart
- WTI is trading near $58.25 ahead of Tokyo open on Thursday.
- The energy benchmark is close to four-month high but still needs to clear an upward sloping trend-line that joins highs marked during December 2018 and February 2019 at $58.40 now.
- Should the quote surpasses $58.40 on a daily closing basis, 50% Fibonacci retracement of its October-December moves around $59.60, adjacent to $60.00, can entertain buyers ahead of challenging them with $62.00 and 200-day simple moving average (SMA) near $62.10.
- In case prices take a U-turn, $57.60-50 horizontal-region comprising recent highs since February 20 could offer immediate support.
- Break of $57.50 highlights the importance of 38.2% Fibonacci retracement level of $55.60.
- However, 50-day and 100-day SMA confluence around $54.10-20 can limit downside past-$55.60.
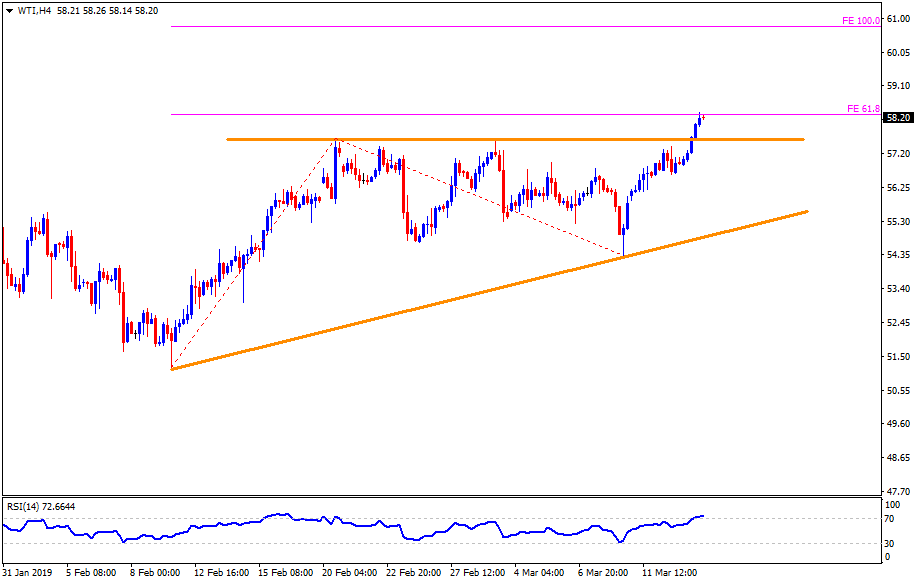
WTI 4-Hour chart
- 61.8% Fibonacci expansion (FE) of February 11 to March 08 moves increases the importance of $58.40 resistance.
- 100% FE level of $61.00 can act as an intermediate halt between $60.00 and $62.00.
- Also, an ascending support-line at $55.00 may provide stop after $55.60 break.
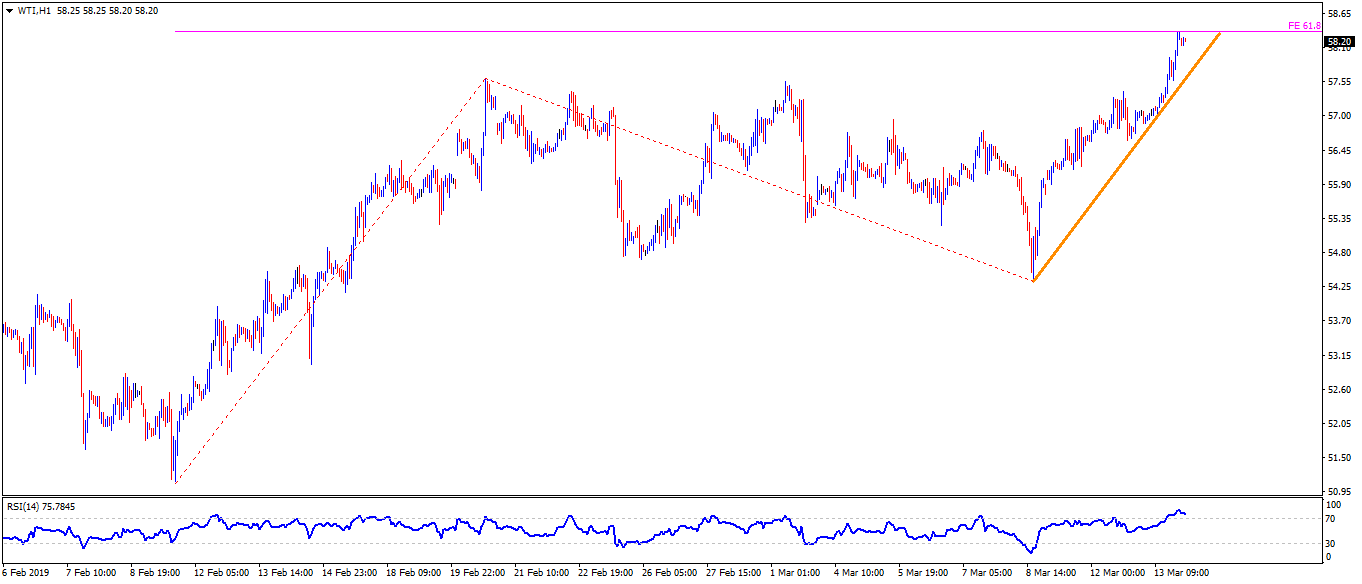
WTI hourly chart
- An immediate upward sloping trend-line joining lows since Friday can question counter-trend traders at $57.80.
- 14-bar relative strength index (RSI) is also witnessing pullback from the overbought region, indicating profit-booking.