- Steady downside and fundamental catalysts portray near-term weakness.
- Symmetrical triangle holds the immediate moves confined.
While gradual declines from $66.60 portray WTI weakness, the black gold presently follows a short-term symmetrical triangle as it tests $61.70 ahead of the European open on Thursday.
However, failure to please buyers even after upbeat catalyst and trade tensions continue weighing on the price sentiment.
As a result, a break of $61.45 support could trigger the energy benchmark’s drop towards eight-month-old ascending trend-line around $60.00.
Given the bears refrain from respecting $60.00 as support, 61.8% Fibonacci retracement of its March – April upside, at $59.10, followed by $57.80, can please the bears.
Meanwhile, an upside clearance of $62.00 pattern resistance can propel the quote towards 200-hour moving average that’s currently around $62.70.
In a case where optimism sustains past-$62.70, late-April highs near $64.80 and the previous-month tops near $65.60 may grab market attention.
WTI 4-Hour chart
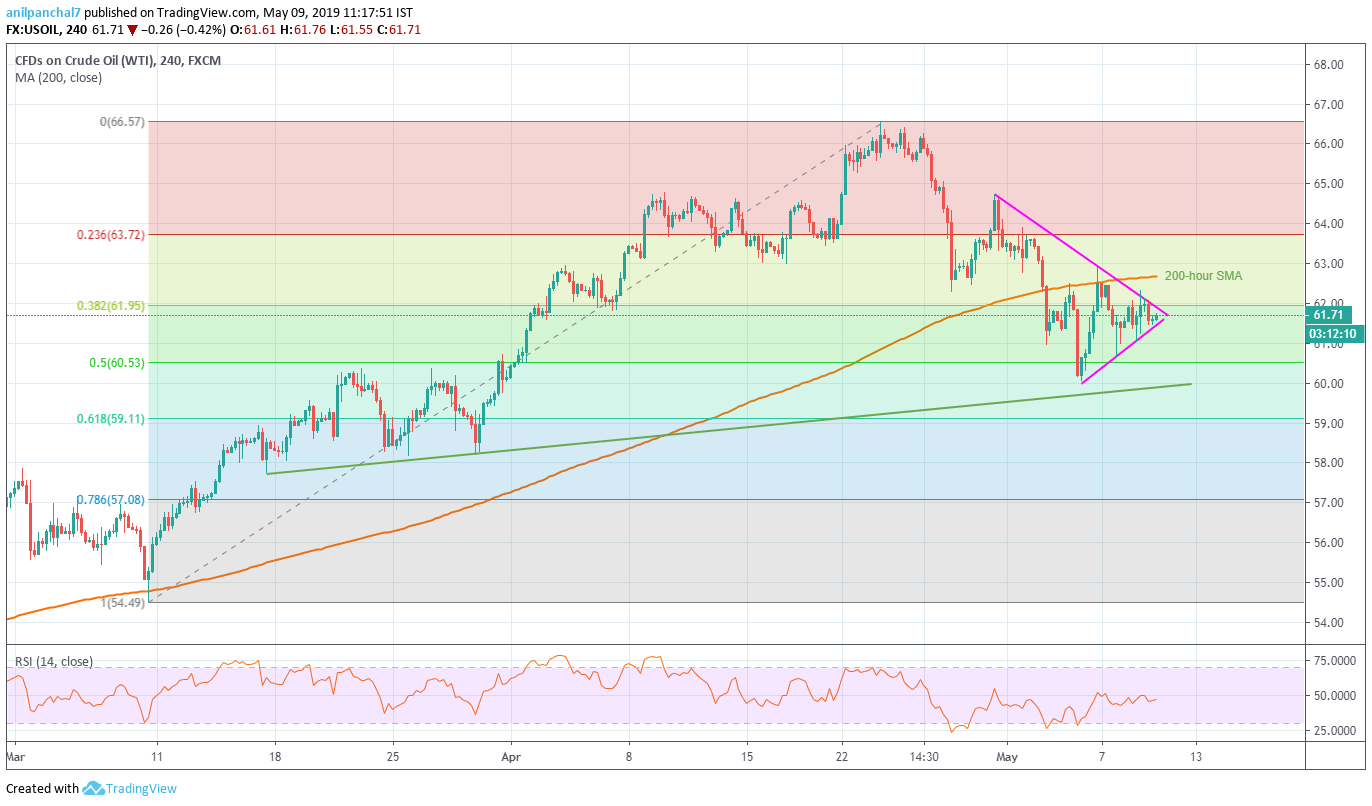
Trend: Bearish
